


| Followers | 679 |
| Posts | 141047 |
| Boards Moderated | 36 |
| Alias Born | 03/10/2004 |
Wednesday, September 21, 2022 7:27:44 PM
Timing The US Market Crash - A Roadmap...
By: Clive Maund | September 21, 2022
With world stockmarkets looking increasingly fragile in the face of rising interest rates, especially in the US and the traditional crash season at hand, this is a good time for us to take an updated look at the charts for the broad stockmarket. We last took a good look at the broad market on 28th August when we observed that it has been in a bearmarket since the start of the year. However, up until now the decline has been relatively gradual. We are looking at it again now because of the growing risk of it accelerating away to the downside. Here it should be pointed out that, given the state of the economy and the outlook, the market should be much lower, and it is only because of Fed meddling and buying the market, perhaps through Blackrock and Vanguard etc that it isn’t. We know that they can create unlimited money for this purpose, which is why we have been wary of shorting the market, and then they stick society at large with the bill via increasing inflation.
We have continued to buy and trade stocks in recent weeks because even though the overall trend of the market is down, individual stocks can go up for their own reasons, but if we see the broad market pick up momentum on the downside that will become more difficult and given where we are in the market cycle, albeit a Fed distorted one, it will probably behove us to figure out some ways to make money out of a falling market.
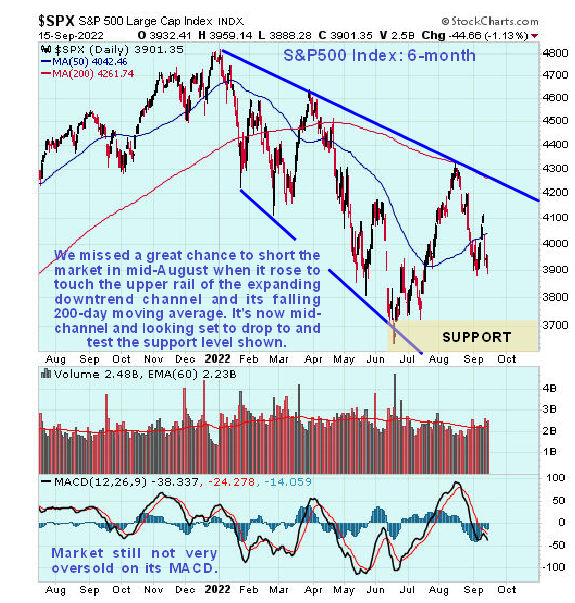
Looking at the latest 6-month chart for the S&P500 index, we can see that the market has been falling within an expanding downtrend channel which it is currently in the middle of and heading towards the support shown above its lower boundary. If this support fails then we can expect it to head towards the lower channel boundary at least. We missed a great opportunity to short it when it touched the upper rail of the channel in mid-August and also the falling 200-day moving average. Before leaving this chart note that it is still not very oversold on its MACD indicator.
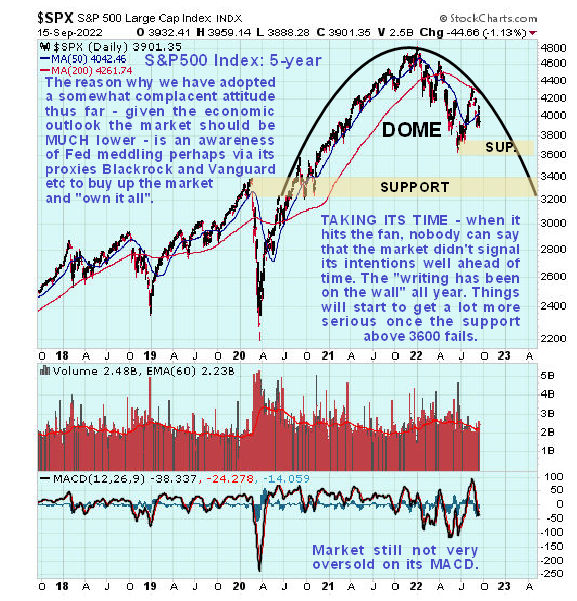
In August the 5-year chart helped us to determine that we are in an established bearmarket and this chart makes very clear what is going on. The market is rounding over and gradually accelerating to the downside beneath a Dome top pattern, just as it did in 2008. This chart portends eventual failure of the support levels shown leading to a severe decline or a crash, which would hardly be surprising considering the abyssmal state of the economy and worsening outlook. Downside risk will increase significantly once the support shown at above the 3600 level fails. Again it is worth noting that the market is not oversold on its MACD on this chart, which means that technically there is plenty of room for it to drop.
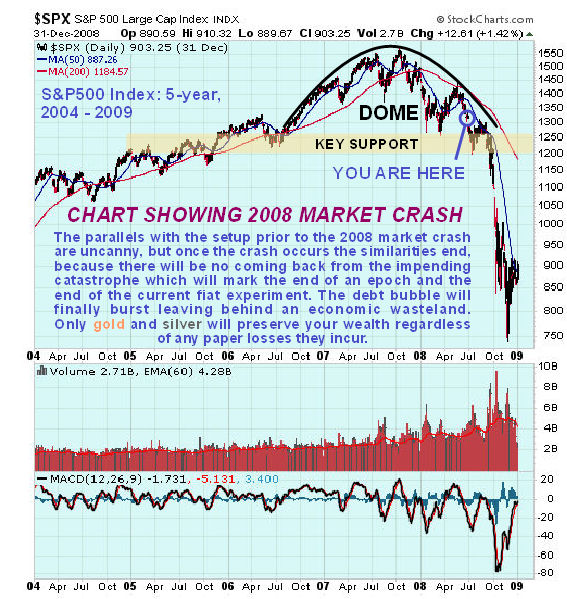
On the 5-year chart for the S&P500 index that includes the period of the 2008 market crash we can see the uncanny and frightening similarity between our 5-year chart for the S&P500 index now and this chart. Little needs to be said about this as the similarities are so obvious but it is interesting to see how the rally towards the Dome boundary in August of this year corresponds to a very similar rally back in May – June of 2008 before the market then rolled over and dropped as it is now doing but at that time, after breaking a support level and dropping to new lows it stabilised for a few months and had a last gasp rally before finally breaking down and cratering when the crash phase occurred. Compare these 2 charts and you will have yourself a roadmap. If the pattern repeats, which it won’t necessarily, then we could see it pan out in a similar manner. A final very important point to note is that after the market crashed in 2008 the Fed opened the spigots and flooded the system with repeated bouts of QE. It can’t do that this time as the system is already maxxed out with all tools in the toolbox having been used, so there won’t be any similar recovery, especially as the debt market will have blown to smithereens leaving behind an economic wasteland.
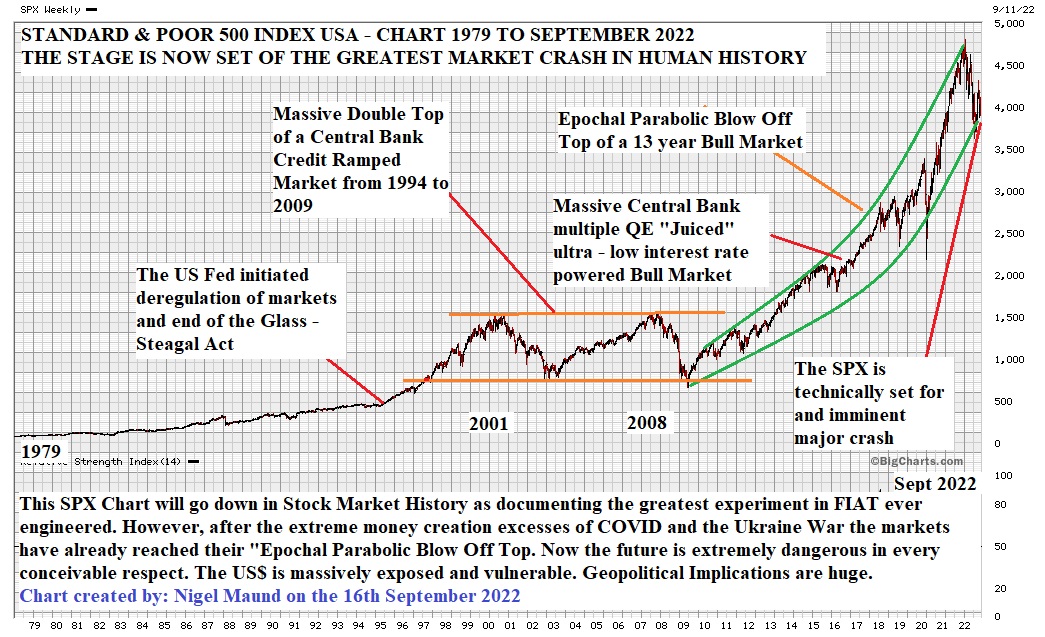
We will end this article with a very long-term chart of the S&P500 index submitted to me by my brother Nigel Maund just this morning. I believe Nigel’s lurid and frightening analysis and description are broadly correct and the only reason that I have been relatively complacent up to now is not wanting to be right too soon – these scenarios take time to play out, although time is now running out fast.
Before packing up and heading for the hills, I recommend that you obtain as much physical gold and silver as you can, and don’t worry about the possibility of a drop in the paper price of gold and silver during the early stages of a market crash, because what matters is their instrinsic value, the paper price at this stage is irrelevant – it’s no good being able to theoretically buy them at a lower price if there isn’t any to buy which is why these metals are expected to break ranks with the stockmarket at some point and soar. When it hits the fan you will be able to trade physical gold and silver for things you need, especially silver which is more useful in this regard, whereas fiat banknotes could well become utterly worthless.
Read Full Story »»»
 DiscoverGold
By: Clive Maund | September 21, 2022
With world stockmarkets looking increasingly fragile in the face of rising interest rates, especially in the US and the traditional crash season at hand, this is a good time for us to take an updated look at the charts for the broad stockmarket. We last took a good look at the broad market on 28th August when we observed that it has been in a bearmarket since the start of the year. However, up until now the decline has been relatively gradual. We are looking at it again now because of the growing risk of it accelerating away to the downside. Here it should be pointed out that, given the state of the economy and the outlook, the market should be much lower, and it is only because of Fed meddling and buying the market, perhaps through Blackrock and Vanguard etc that it isn’t. We know that they can create unlimited money for this purpose, which is why we have been wary of shorting the market, and then they stick society at large with the bill via increasing inflation.
We have continued to buy and trade stocks in recent weeks because even though the overall trend of the market is down, individual stocks can go up for their own reasons, but if we see the broad market pick up momentum on the downside that will become more difficult and given where we are in the market cycle, albeit a Fed distorted one, it will probably behove us to figure out some ways to make money out of a falling market.
Looking at the latest 6-month chart for the S&P500 index, we can see that the market has been falling within an expanding downtrend channel which it is currently in the middle of and heading towards the support shown above its lower boundary. If this support fails then we can expect it to head towards the lower channel boundary at least. We missed a great opportunity to short it when it touched the upper rail of the channel in mid-August and also the falling 200-day moving average. Before leaving this chart note that it is still not very oversold on its MACD indicator.

In August the 5-year chart helped us to determine that we are in an established bearmarket and this chart makes very clear what is going on. The market is rounding over and gradually accelerating to the downside beneath a Dome top pattern, just as it did in 2008. This chart portends eventual failure of the support levels shown leading to a severe decline or a crash, which would hardly be surprising considering the abyssmal state of the economy and worsening outlook. Downside risk will increase significantly once the support shown at above the 3600 level fails. Again it is worth noting that the market is not oversold on its MACD on this chart, which means that technically there is plenty of room for it to drop.


On the 5-year chart for the S&P500 index that includes the period of the 2008 market crash we can see the uncanny and frightening similarity between our 5-year chart for the S&P500 index now and this chart. Little needs to be said about this as the similarities are so obvious but it is interesting to see how the rally towards the Dome boundary in August of this year corresponds to a very similar rally back in May – June of 2008 before the market then rolled over and dropped as it is now doing but at that time, after breaking a support level and dropping to new lows it stabilised for a few months and had a last gasp rally before finally breaking down and cratering when the crash phase occurred. Compare these 2 charts and you will have yourself a roadmap. If the pattern repeats, which it won’t necessarily, then we could see it pan out in a similar manner. A final very important point to note is that after the market crashed in 2008 the Fed opened the spigots and flooded the system with repeated bouts of QE. It can’t do that this time as the system is already maxxed out with all tools in the toolbox having been used, so there won’t be any similar recovery, especially as the debt market will have blown to smithereens leaving behind an economic wasteland.
We will end this article with a very long-term chart of the S&P500 index submitted to me by my brother Nigel Maund just this morning. I believe Nigel’s lurid and frightening analysis and description are broadly correct and the only reason that I have been relatively complacent up to now is not wanting to be right too soon – these scenarios take time to play out, although time is now running out fast.

Before packing up and heading for the hills, I recommend that you obtain as much physical gold and silver as you can, and don’t worry about the possibility of a drop in the paper price of gold and silver during the early stages of a market crash, because what matters is their instrinsic value, the paper price at this stage is irrelevant – it’s no good being able to theoretically buy them at a lower price if there isn’t any to buy which is why these metals are expected to break ranks with the stockmarket at some point and soar. When it hits the fan you will be able to trade physical gold and silver for things you need, especially silver which is more useful in this regard, whereas fiat banknotes could well become utterly worthless.
Read Full Story »»»
 DiscoverGold
Information posted to this board is not meant to suggest any specific action, but to point out the technical signs that can help our readers make their own specific decisions. Caveat emptor!
• DiscoverGold
Join the InvestorsHub Community
Register for free to join our community of investors and share your ideas. You will also get access to streaming quotes, interactive charts, trades, portfolio, live options flow and more tools.

