


| Followers | 682 |
| Posts | 142059 |
| Boards Moderated | 35 |
| Alias Born | 03/10/2004 |
Friday, September 02, 2022 10:08:26 PM
By: David Keller | September 2, 2022
I find semiconductors to be an important group to watch, given that they essentially provide the "backbone" to our modern information economy. Pretty much every product we use at this point has a chip involved, so if chip makers are doing well, then I can assume the economy is doing just fine.
The failure of stocks like Nvidia Corp. (NVDA) to make a new high in January, while the S&P 500 did so, suggested caution and limited upside, which proved prescient. So what does it mean now that NVDA made a new low for 2022 this week?
First, let's review how 2022 has played out for this stock, and use a "measured move" technique to identify potential downside targets.
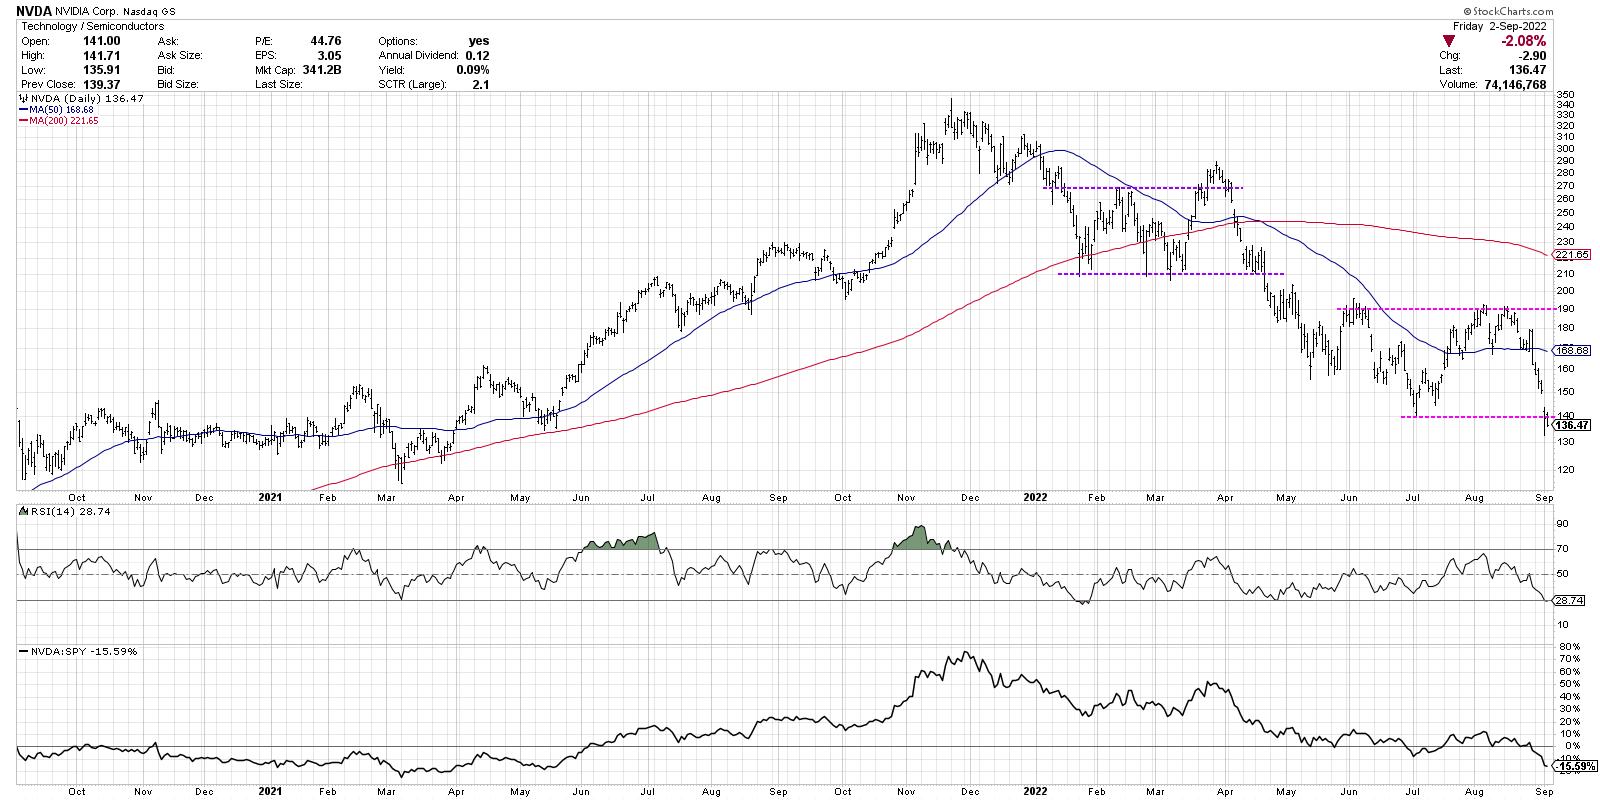
After NVDA bottomed out in January around $210, the stock spent the next three months fluctuating between 210 as support and 270-290 as resistance. This consolidation period, indicated with purple trend lines, could be called a rectangle pattern and indicates a market in equilibrium. Even though there are short-term price swings, the price was essentially rotating around a midpoint around $240. The market is basically telling you that, at this point in time, NVDA is worth about $240 a share.
In late March, the stock broke out of the pattern to the upside, but this breakout was short-lived. Just as the S&P 500 had a failed breakout above the 4600 level at this time, NVDA ended up stalling out and re-entering the consolidation area. Then in April, the price exited the pattern to the downside, confirming a new down leg in this bearish phase. Now we can use a measured move technique to anticipate a potential downside target.
What is a measured move? While there are a number of variations of this approach in the technical toolkit (even more advanced methodologies like Elliott Wave), I like to keep it simple. Basically, the trend leading into a consolidation pattern is often matched with the trend leading out of the pattern.
Let's review the chart of NVDA and consider that first breakdown in April 2022.

If you take the initial downthrust from November 2021 to January 2022, then assume a similar trajectory after the breakdown in April, that would suggest a downside objective around $160. NVDA did indeed bounce off this level of support, which led to another consolidation phase between $140 and $190 (indicated with pink trend lines).
So what can does a similar approach tell us about the current situation for this important stock?

The move from the March swing high down to the upper end of the pattern is about a $100 move (290 to 190). We're using log scale for this demonstration, so a similar percent move (blue arrows) would give a downside target around 90-95.
Now here's the real question. If NVDA does reach that downside target, that would be about another 30% below current levels. What would the Nasdaq Composite do in that scenario? How about the S&P 500?
While we can run similar analysis on the major averages themselves, I have found that by some of the best tells in the market often come from analyzing specific stocks and groups, then comparing those signals to the broader indexes. In the case of Nvidia, the measured move technique suggests the bear market phase could still have plenty of room to move.
Read Full Story »»»
 DiscoverGold
Information posted to this board is not meant to suggest any specific action, but to point out the technical signs that can help our readers make their own specific decisions. Caveat emptor!
• DiscoverGold
Recent NVDA News
- Form 144 - Report of proposed sale of securities • Edgar (US Regulatory) • 06/14/2024 08:51:55 PM
- Form 144 - Report of proposed sale of securities • Edgar (US Regulatory) • 06/14/2024 08:29:57 PM
- Form 4 - Statement of changes in beneficial ownership of securities • Edgar (US Regulatory) • 06/13/2024 09:52:15 PM
- Form 144 - Report of proposed sale of securities • Edgar (US Regulatory) • 06/13/2024 08:39:28 PM
- NVIDIA Stockholder Meeting Set for June 26; Individuals Can Participate Online • GlobeNewswire Inc. • 06/12/2024 09:00:00 PM
- Form 4 - Statement of changes in beneficial ownership of securities • Edgar (US Regulatory) • 06/10/2024 08:55:57 PM
- Apple Showcases AI at WWDC 2024, Nvidia Stock Split Starts Today, and More News • IH Market News • 06/10/2024 11:29:44 AM
- Form 4 - Statement of changes in beneficial ownership of securities • Edgar (US Regulatory) • 06/07/2024 09:15:17 PM
- Form 4 - Statement of changes in beneficial ownership of securities • Edgar (US Regulatory) • 06/07/2024 09:14:22 PM
- Form 4 - Statement of changes in beneficial ownership of securities • Edgar (US Regulatory) • 06/07/2024 09:12:44 PM
- Form 8-K - Current report • Edgar (US Regulatory) • 06/07/2024 08:19:34 PM
- Form 144 - Report of proposed sale of securities • Edgar (US Regulatory) • 06/07/2024 08:02:43 PM
- GME Volatile as Roaring Kitty Goes Live Today, Meta Unveils AI for WhatsApp Ads, and More • IH Market News • 06/07/2024 12:09:15 PM
- Traders May Take A Breather Following Yesterday’s Rally As Jobs Data Looms • IH Market News • 06/06/2024 01:08:35 PM
- Nvidia Becomes 2nd Most Valuable Company in the USA, ASML Takes 2nd Spot in Europe, and More News • IH Market News • 06/06/2024 11:34:59 AM
- US Index Futures Mixed; Oil Prices Rise • IH Market News • 06/06/2024 11:29:43 AM
- Nvidia’s Market Value Surges, Overtaking Apple • IH Market News • 06/06/2024 09:17:39 AM
- Form 4 - Statement of changes in beneficial ownership of securities • Edgar (US Regulatory) • 06/05/2024 09:02:53 PM
- Form 4 - Statement of changes in beneficial ownership of securities • Edgar (US Regulatory) • 06/05/2024 09:02:25 PM
- Form 4 - Statement of changes in beneficial ownership of securities • Edgar (US Regulatory) • 06/05/2024 09:01:29 PM
- Nasdaq, S&P 500 Rally To New Record Closing Highs • IH Market News • 06/05/2024 08:46:00 PM
- Weaker Than Expected Jobs Data May Lead To Strength On Wall Street • IH Market News • 06/05/2024 01:05:35 PM
- U.S. Stocks Close On Mixed Note • IH Market News • 06/03/2024 08:44:00 PM
- NVIDIA Enables Real-Time Healthcare, Industrial and Scientific AI Applications at the Edge With Enterprise Software Support for NVIDIA IGX With Holoscan • GlobeNewswire Inc. • 06/02/2024 12:56:50 PM
- NVIDIA Robotics Adopted by Industry Leaders for Development of Tens of Millions of AI-Powered Autonomous Machines • GlobeNewswire Inc. • 06/02/2024 12:52:01 PM
ECGI Holdings Announces LOI to Acquire Pacific Saddlery to Capitalize on $12.72 Billion Market Potential • ECGI • Jun 13, 2024 9:50 AM
Fifty 1 Labs, Inc. Announces Major Strategic Advancements and Shareholder Updates • CAFI • Jun 13, 2024 8:45 AM
Snakes & Lattes Opens Pop-Up Location at The Wellington Market in Toronto: A New Destination for Fun and Games - Thanks 'The Well', PepsiCo, Indie Pale House & All Sponsors & Partners for Their Commitment & Assistance Throughout The Process • FUNN • Jun 13, 2024 8:18 AM
HealthLynked Introduces Innovative Online Medical Record Request Form Using DocuSign • HLYK • Jun 12, 2024 8:00 AM
Ubiquitech Software Corp (OTC:UBQU) Posts $624,585 Quarterly Revenue - Largest Quarter Since 2018 • UBQU • Jun 11, 2024 10:13 AM
Element79 Gold Corp Files for OTCQB Uplisting, Provides Financial Update • ELEM • Jun 11, 2024 9:25 AM

