


| Followers | 689 |
| Posts | 143817 |
| Boards Moderated | 35 |
| Alias Born | 03/10/2004 |
Wednesday, July 06, 2022 12:55:18 PM
By: Tom Bowley | July 6, 2022
In case you haven't followed my work, I was very bearish U.S. equities as we opened 2022. I didn't wait to see the carnage to tell you that there was carnage. I predicted the carnage before we ever saw it. Included in those bearish predictions was a wild prediction about Apple, Inc. (AAPL) on January 4th, 2022. I suggested that AAPL could fall 20-30%. You can check out what I wrote in the following article, "The Great Divide Presents Big Problems....and a Wild Prediction for Apple (AAPL)". After you read the article, make sure you "subscribe" to my Trading Places blog below the article. If you provide StockCharts.com your name and email address in the space provided, all of my Trading Places blog articles will be sent directly to your inbox as soon as my articles are published. That way, you won't miss another one.
In my January 7th ChartWatchers article, I published a chart of AAPL, showing the history of significant declines in its past and, once again, suggesting that AAPL could see a selloff of 20-30%. I went on to show a chart that would illustrate what AAPL would look like if it were to fall 35% - as it did in previous down cycles. Here's the chart I showed then, with the subsequent 2022 market action in the chart as well:
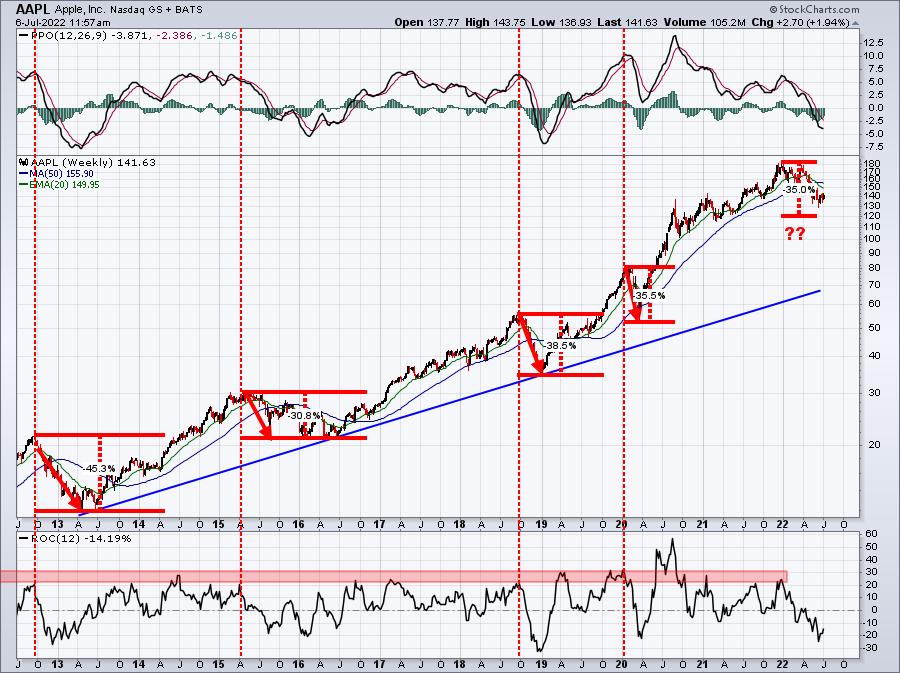
Now REMEMBER, this chart was provided in early January at the market top. There was no Monday morning quarterbacking here. There are a lot of perma-bull AAPL fans out there that criticized me at the time. But I'm sure they wish they had sold back then now.
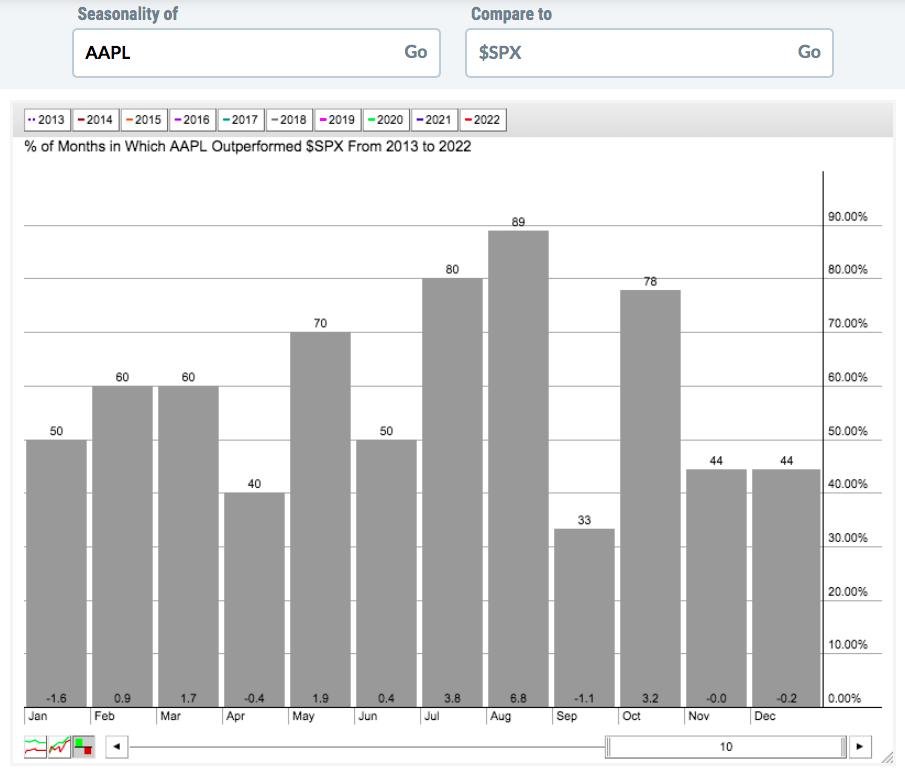
So what's my current thinking on AAPL? I LOVE IT! Could it move lower? Sure, but its history suggests that we buy these types of corrections. AAPL reached a low of 129.04 on June 16th, which represented a 29.27% decline off of its all-time high of 182.44 on January 4th, 2022. There's a historical component that makes AAPL very compelling right now. Since the S&P 500 broke out to new all-time highs on April 10, 2013 (clearing tops in 2000 and 2007), AAPL's best two consecutive calendar months for relative performance is July and August. You don't have to believe me, just look at this seasonal chart:
Finally, let's take a quick look at the positive divergence (slowing selling momentum) that's printed on AAPL's daily chart:
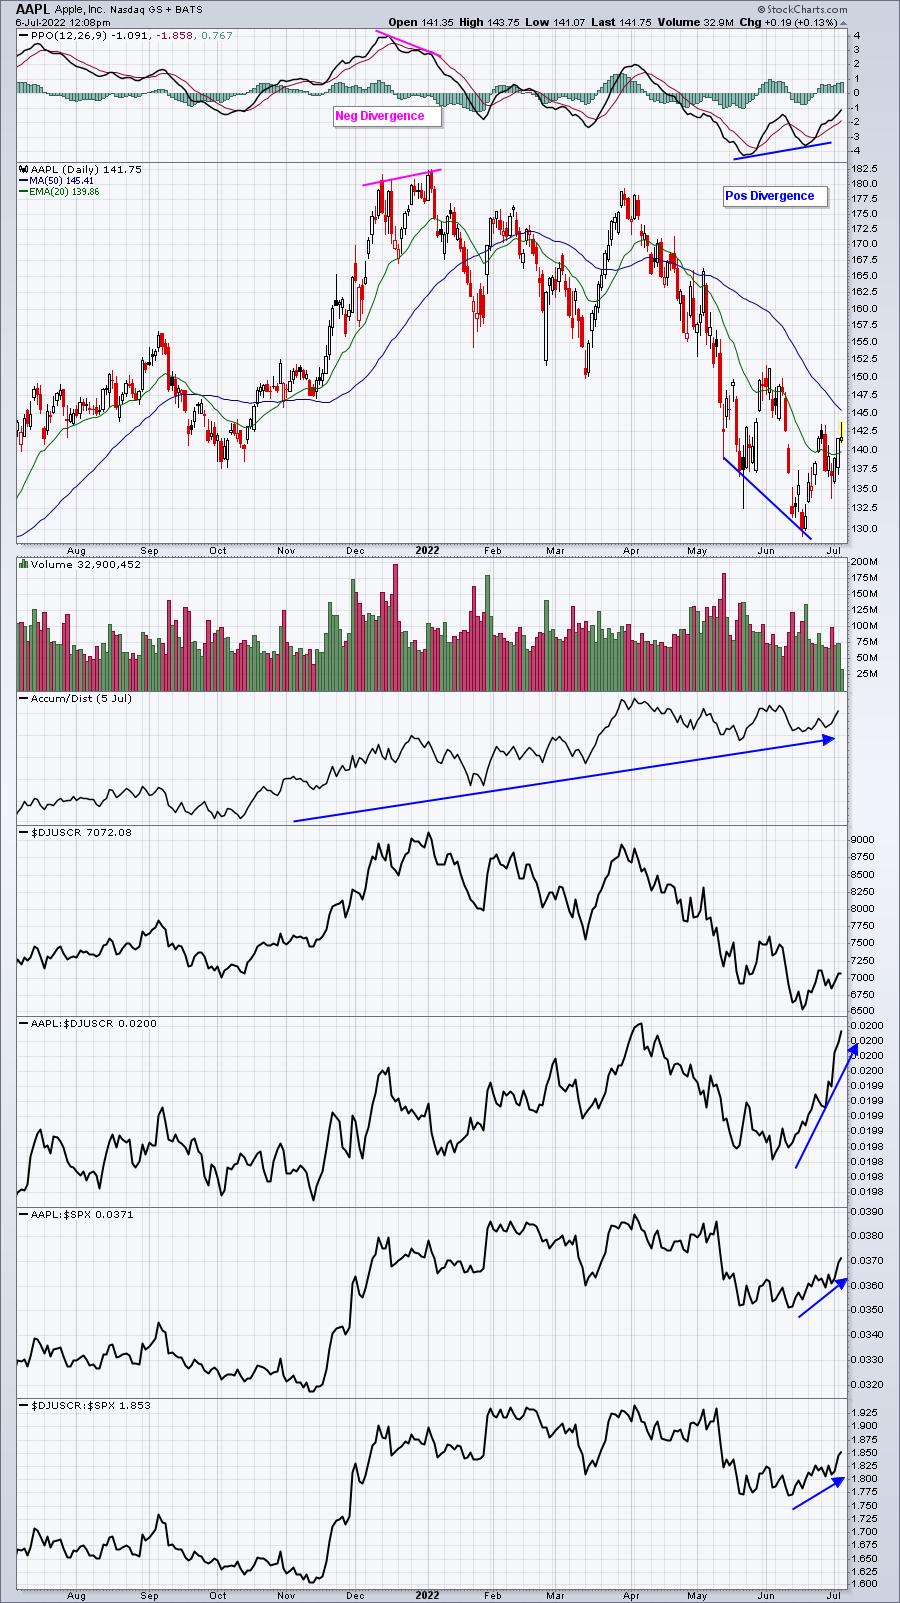
Note that AAPL flashed a negative divergence to support the notion of slowing buying momentum and the bearish theory back in January.
Read Full Story »»»
 DiscoverGold
Information posted to this board is not meant to suggest any specific action, but to point out the technical signs that can help our readers make their own specific decisions. Caveat emptor!
• DiscoverGold
Recent AAPL News
- Visa Faces Monopoly Lawsuit; Meta Introduces Celebrity Voices for Chatbot; Stellantis on the Hunt for New CEO • IH Market News • 09/24/2024 10:15:50 AM
- Nike Shares Surge 7% Pre-Market as Elliott Hill Becomes CEO; FedEx Shares Tumble 13% After Profit Miss • IH Market News • 09/20/2024 10:02:58 AM
- Meta Strengthens Child Privacy on Instagram; Google Overturns $1.7 Billion Antitrust Fine; Snap Updates Spectacles • IH Market News • 09/18/2024 10:13:07 AM
- Microsoft Boosts Share Buyback, Raises Dividends by 10%, Intel Secures Chip Deal with Amazon • IH Market News • 09/17/2024 10:40:35 AM
- OpenAI Unveils Strawberry AI Model Series; Boeing Stock Falls 4% Amid Strike; HR Surges 20% on Growth Forecast • IH Market News • 09/13/2024 10:12:55 AM
- Form 8-K - Current report • Edgar (US Regulatory) • 09/10/2024 01:06:34 PM
- Apple Loses EU Dispute; Google’s $2.7 Billion Fine Upheld; Oracle Shares Surge 9% • IH Market News • 09/10/2024 10:02:31 AM
- Apple introduces groundbreaking health features to support conditions impacting billions of people • Business Wire • 09/09/2024 06:41:00 PM
- Introducing Apple Watch Series 10 • Business Wire • 09/09/2024 06:36:00 PM
- Apple introduces iPhone 16 and iPhone 16 Plus • Business Wire • 09/09/2024 06:36:00 PM
- Apple introduces AirPods 4 and the world’s first all-in-one hearing health experience with AirPods Pro 2 • Business Wire • 09/09/2024 06:36:00 PM
- Apple Watch Ultra 2 now available in black titanium • Business Wire • 09/09/2024 06:36:00 PM
- Apple debuts iPhone 16 Pro and iPhone 16 Pro Max • Business Wire • 09/09/2024 06:36:00 PM
- Dell, Palantir, and Erie Will Be Added to the S&P 500; Boeing Avoids Strike; Apple Event Takes Place Today • IH Market News • 09/09/2024 10:05:35 AM
- Broadcom Down 10% Post-Earnings, UiPath Up 8%; Qualcomm Eyes Intel Assets; Salesforce Acquires Own Company • IH Market News • 09/06/2024 11:59:00 AM
- Nvidia Subpoenaed by DOJ, Athira Pharma Shares Plunge 71% After Study Fails, Zscaler Falls 15% Post-Earnings • IH Market News • 09/04/2024 09:50:25 AM
- Big Lots Falls 27%, Considers Bankruptcy; DraftKings Acquires Simplebet, Berkshire Hits $1 Trillion • IH Market News • 08/29/2024 10:06:50 AM
- High Volatility Expected in Nvidia Report, Ambarella Soars 20%, Hertz Strengthens Board, Apple Cuts Jobs • IH Market News • 08/28/2024 09:50:36 AM
- Apple Names New CFO, Sony Hikes PS5 Price in Japan, Santander Launches Share Buyback • IH Market News • 08/27/2024 09:35:22 AM
- Stacks Prepares Nakamoto Upgrade, Record Bitcoin ETF Inflows, Semler Scientific Expands Bitcoin Reserves • IH Market News • 08/26/2024 10:35:56 PM
- Form 8-K - Current report • Edgar (US Regulatory) • 08/26/2024 09:20:33 PM
- Apple announces Chief Financial Officer transition • Business Wire • 08/26/2024 08:30:00 PM
- IBM Closes China Research Division, Uber Fined $324M, Starliner to Return Without Astronauts • IH Market News • 08/26/2024 12:58:21 PM
- Form 8-K - Current report • Edgar (US Regulatory) • 08/23/2024 08:30:44 PM
- Cruise and Uber Join Forces for Robotaxis, Alibaba Shifts Primary Listing to Hong Kong, Altria Hikes Dividend 4.1% • IH Market News • 08/23/2024 12:20:26 PM
FEATURED Cannabix Technologies and Omega Laboratories Inc. Advance Marijuana Breathalyzer Technology - Dr. Bruce Goldberger to Present at Society of Forensic Toxicologists Conference • Sep 24, 2024 8:50 AM
FEATURED Integrated Ventures, Inc Announces Strategic Partnership For GLP-1 (Semaglutide) Procurement Through MedWell USA, LLC. • Sep 24, 2024 8:45 AM
Avant Technologies Accelerates Creation of AI-Powered Platform to Revolutionize Patient Care • AVAI • Sep 24, 2024 8:00 AM
VHAI - Vocodia Partners with Leading Political Super PACs to Revolutionize Fundraising Efforts • VHAI • Sep 19, 2024 11:48 AM
Dear Cashmere Group Holding Co. AKA Swifty Global Signs Binding Letter of Intent to be Acquired by Signing Day Sports • DRCR • Sep 19, 2024 10:26 AM
HealthLynked Launches Virtual Urgent Care Through Partnership with Lyric Health. • HLYK • Sep 19, 2024 8:00 AM

