Sentiment Just Like Bear Markets By: Bespoke Investment Group | May 12, 2022
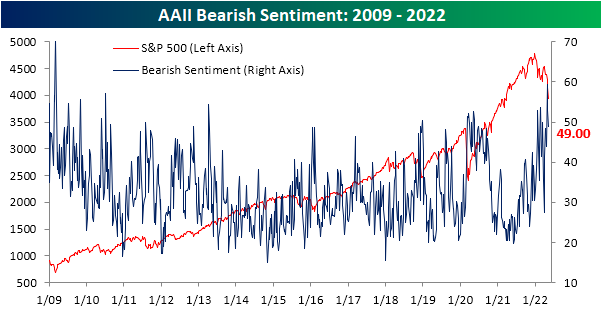
The past week may have seen the S&P 500 and other major US indices breach to fresh lows on steep declines that are nearing bear market territory, but the AAII sentiment survey has not fallen to its own lows as might have been expected. Bullish sentiment fell back below 25% this week but is still several percentage points above the lows in the teens from only a few weeks prior.
Historically, when the S&P 500 has hit 52-week lows as it has in the past week, bullish sentiment has usually been even higher with an average reading of 29.15%. The chart below shows the levels of bearish, bullish, and neutral sentiment in the AAII survey at the time the S&P 500 first traded into bear market territory (down 20% from a prior peak) for each bear market since the survey began in 1987. At 24.3% now, the current reading of bullish sentiment is on the low side compared to prior bear markets. The only two bear markets where bullish sentiment was lower were July 2008 and February 2009.
Although bullish sentiment declined, bearish sentiment also pulled back below 50% for the first time since the week of April 20th. Even with the decline, though, bearish sentiment remains at a historically high level.
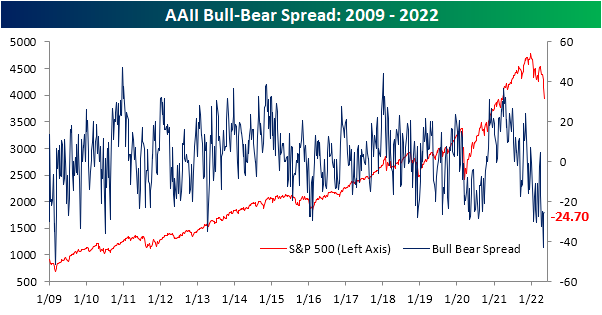
Given the moves, the bull-bear spread was higher for a second week in a row after it had reached the lowest level since March 2009 two weeks ago. Again, in spite of those improvements, the current level remains in the bottom 5% of all weeks on record.
The year is already a third over, and sentiment has found no respite after multiple months of declines in equity prices. In fact, bullish sentiment has not seen a single week with a reading above its historical average, and there has only been one such week for bearish sentiment. In the charts below, we show the average bullish and bearish sentiment reading by year since the start of the survey in 1987. While there's still a lot of time left for things to change, with an average bullish sentiment reading of just 24.42% at this point in 2022, this year ranks as the worst year for bullish sentiment in the history of the survey (since 1987), although 1988 and 1990 have come close with average readings of around 27%. Meanwhile, the average reading on bearish sentiment has been 44.3% this year. 2008 is the only other year with a higher average reading at 45%. In other words, it is hard to find a comparable year since the late 1980s where optimism has been this low and pessimism this high. Click here to learn more about Bespoke's premium stock market research service.
Information posted to this board is not meant to suggest any specific action, but to point out the technical signs that can help our readers make their own specific decisions. Caveat emptor! • DiscoverGold
Register for free to join our community of investors and share your ideas. You will also get access to streaming quotes, interactive charts, trades, portfolio, live options flow and more tools.


 News
News  Market Data
  Discover