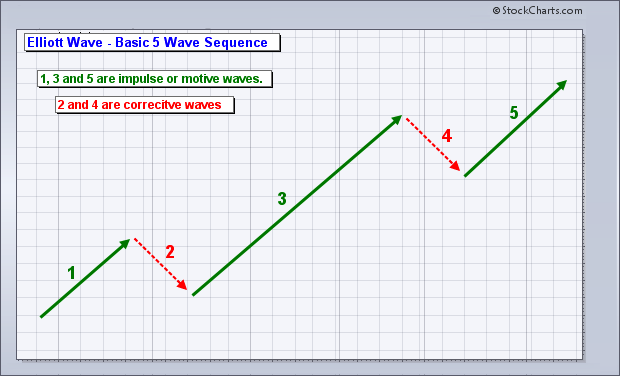
DJIA - Showing Market has Topped Sell after an Elliott Wave 5-Wave Advance https://investorshub.advfn.com/uicon/155361.png?cb=636360310707230000 _________________________________________________________________ The Elliott Wave 5-Waves Sequence A Basic "A,B,C Corrective Wave" https://www.metatrader5.com/en/terminal/help/objects/elliott/elliott_theory Elliott Wave Basics http://www.acrotec.com/ewt.htm https://investorshub.advfn.com/uimage/uploads/2018/1/20/fofsgElliott_Wave_Basic_5_Wave_Sequence.png investorshub.advfn.com/uimage/uploads/2019/3/27/orjmdElliott_Wave_Example_2_with_Wave_Count_shown.png ________________________________________________________________ Embedded Chart https://investorshub.advfn.com/uimage/uploads/2022/1/21/pzjvxDJIA_Jan_21_2022_Annotated_1825_day_Weekly_Chart_showing_expected_Decline_with_EW.PNG Live! Charts https://www.stockscores.com/chart.asp?TickerSymbol=$DOWI&TimeRange=1825&Interval=w&Volume=1&ChartType=OHLC&Stockscores=1&ChartWidth=1100&ChartHeight=480&LogScale=None&Band=None&avgType1=SMA&movAvg1=8&avgType2=SMA&movAvg2=34&Indicator1=RSI&Indicator2=PPO&Indicator3=AccDist&Indicator4=MFI&endDate=&CompareWith=&entryPrice=&stopLossPrice= _________________________________________________________________ Live! Charts https://finviz.com/fut_chart.ashx?t=YM&cot=124601,124603&p=m5&rev=637217407950092959 https://finviz.com/fut_chart.ashx?t=YM&cot=124601,124603&p=h1&rev=637217408852448913 https://finviz.com/fut_chart.ashx?t=YM&cot=124601,124603&p=d1&rev=637217409127030211 https://finviz.com/fut_chart.ashx?t=YM&cot=124601,124603&p=w1&rev=637217409454295329 https://finviz.com/fut_chart.ashx?t=YM&cot=124601,124603&p=m1&rev=637217409781059889 _______________________________________________________________ https://finviz.com/fut_chart.ashx?t=YM&cot=124601,124603&p=w1&rev=637217419111884482 https://www.stockscores.com/chart.asp?TickerSymbol=$DOWI&TimeRange=1825&Interval=w&Volume=1&ChartType=OHLC&Stockscores=1&ChartWidth=1100&ChartHeight=480&LogScale=None&Band=None&avgType1=SMA&movAvg1=8&avgType2=SMA&movAvg2=34&Indicator1=RSI&Indicator2=PPO&Indicator3=AccDist&Indicator4=MFI&endDate=&CompareWith=&entryPrice=&stopLossPrice= https://www.stockscores.com/chart.asp?TickerSymbol=$DOWI&TimeRange=3650&Interval=w&Volume=1&ChartType=OHLC&Stockscores=1&ChartWidth=1100&ChartHeight=480&LogScale=None&Band=None&avgType1=SMA&movAvg1=8&avgType2=SMA&movAvg2=34&Indicator1=RSI&Indicator2=PPO&Indicator3=AccDist&Indicator4=MFI&endDate=&CompareWith=&entryPrice=&stopLossPrice= https://www.stockscores.com/chart.asp?TickerSymbol=$DOWI&TimeRange=3650&Interval=m&Volume=1&ChartType=OHLC&Stockscores=1&ChartWidth=1100&ChartHeight=480&LogScale=None&Band=None&avgType1=SMA&movAvg1=8&avgType2=SMA&movAvg2=34&Indicator1=RSI&Indicator2=PPO&Indicator3=AccDist&Indicator4=MFI&endDate=&CompareWith=&entryPrice=&stopLossPrice= https://finviz.com/fut_chart.ashx?t=YM&cot=124601,124603&p=m1&rev=637217421168608925 https://www.stockscores.com/chart.asp?TickerSymbol=$DOWI&TimeRange=7300&Interval=m&Volume=1&ChartType=OHLC&Stockscores=1&ChartWidth=1100&ChartHeight=480&LogScale=None&Band=None&avgType1=SMA&movAvg1=8&avgType2=SMA&movAvg2=34&Indicator1=RSI&Indicator2=PPO&Indicator3=AccDist&Indicator4=MFI&endDate=&CompareWith=&entryPrice=&stopLossPrice= https://www.stockscores.com/chart.asp?TickerSymbol=$DOWI&TimeRange=7300&Interval=w&Volume=1&ChartType=OHLC&Stockscores=1&ChartWidth=1100&ChartHeight=480&LogScale=None&Band=None&avgType1=SMA&movAvg1=8&avgType2=SMA&movAvg2=34&Indicator1=RSI&Indicator2=PPO&Indicator3=AccDist&Indicator4=MFI&endDate=&CompareWith=&entryPrice=&stopLossPrice= https://www.stockscores.com/chart.asp?TickerSymbol=$DOWI&TimeRange=18250&Interval=w&Volume=1&ChartType=OHLC&Stockscores=1&ChartWidth=1100&ChartHeight=480&LogScale=None&Band=None&avgType1=SMA&movAvg1=8&avgType2=SMA&movAvg2=34&Indicator1=RSI&Indicator2=PPO&Indicator3=AccDist&Indicator4=MFI&endDate=&CompareWith=&entryPrice=&stopLossPrice= https://www.stockscores.com/chart.asp?TickerSymbol=$DOWI&TimeRange=18250&Interval=m&Volume=1&ChartType=OHLC&Stockscores=1&ChartWidth=1100&ChartHeight=480&LogScale=None&Band=None&avgType1=SMA&movAvg1=8&avgType2=SMA&movAvg2=34&Indicator1=RSI&Indicator2=PPO&Indicator3=AccDist&Indicator4=MFI&endDate=&CompareWith=&entryPrice=&stopLossPrice= https://investorshub.advfn.com/uicon/155361.png?cb=636360310707230000 https://investorshub.advfn.com/uimage/uploads/2013/8/15/erfjyBig_Wave.jpg
 News
News  Market Data
  Discover