


| Followers | 689 |
| Posts | 143817 |
| Boards Moderated | 35 |
| Alias Born | 03/10/2004 |
Saturday, December 25, 2021 12:15:33 PM
‘Call AAA’: Santa Claus Is Having Sleigh Troubles
By: Spot Gamma | December 23, 2021
• Through an options market lens, the following text will add color to some recent market movements.
Context: At the index level, a dominant position among participants is the protective collar.
In reducing portfolio volatility, customers will sell upside (call) and buy downside (put) protection, against equity, a short-delta trade.
Should the underlying rise, the options part of that trade ought to lose money. It’s a hedge, after all.
The dealer, the counterparty on the other side of this trade, is long delta.
Should the underlying rise, the position ought to make money.
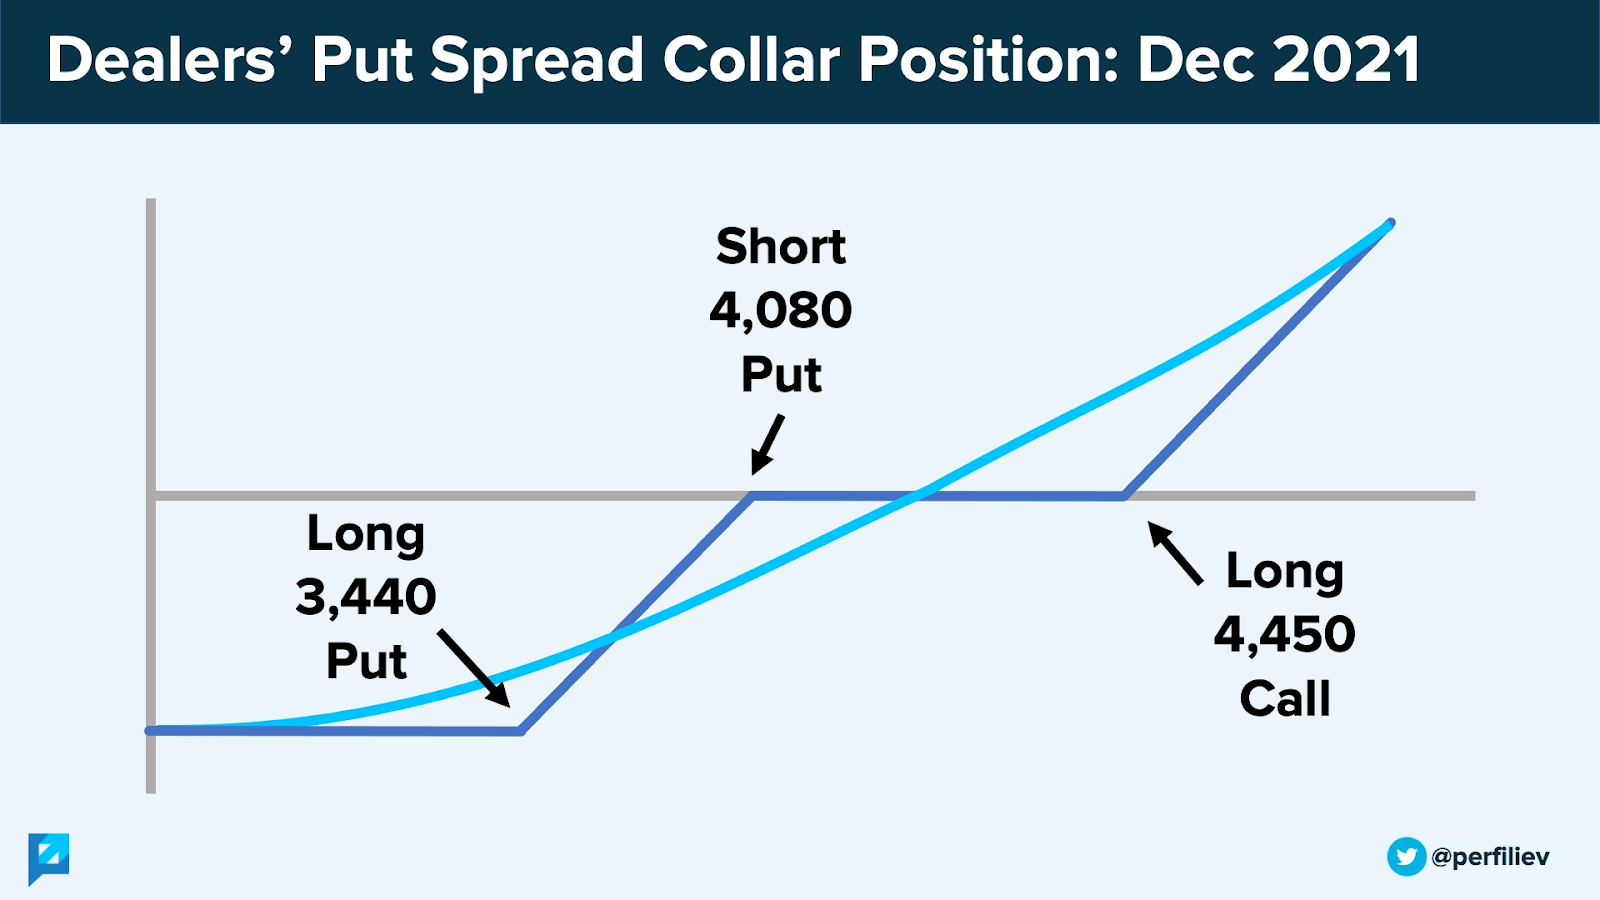
Graphic: Sergei Perfiliev’s, in an amazing write-up, helps us visualize the dealers’ exposure to customer long equity + put spread collar. Note the risk profile’s positive exposure direction.
All else equal, in balancing this exposure, the dealer will buy weakness and sell strength.
Why? To keep it simple, we assume the dealer has no interest in direction.
So, if the dealer will have more (less) exposure to positive delta as the underlying rises (falls), the dealer will sell (buy) underlying.
Now, when a position’s delta rises with stock or index price rises, gamma – how an option’s delta is expected to change given a change in the underlying – is added to delta.
When a position’s delta decreases with stock price falls, gamma is taken from delta.
So, in other words, gamma is “the potential delta-hedging of options positions.”
Moreover, when the aforementioned positioning, at the index level, is indeed dominant, the market is in what is often referred to as long-gamma.
Associated hedging (i.e., buying weakness, selling strength) of prevailing options positioning results in the addition of market liquidity and lower volatility.
As the risk of out-of-the-money customer protection developing intrinsic value declines (i.e., volatility and time trend to zero), dealers are long less delta, and therefore the unwind of hedges introduces positive flows (i.e., unwind of short delta hedges to long delta positions) that support lengthy sprints.
“I use this analogy of a jet,” Kai Volatility’s Cem Karsan once explained, referencing the factors – the change in the underlying price (gamma), implied volatility (vanna), and time (charm) – that impact an options exposure to directional risk or delta.
“As volatility is compressed, those jets will keep firing because … the hedging vanna and charm flows, and whatnot will push the markets higher.”
Context Applied: After the Nov 19 monthly options expiration (OPEX), the aforementioned “positive flows” were withdrawn on the removal/expiry of large options positions.
The market entered into a period of weakness, for lack of better phrasing, given a reduction in supportive gamma, vanna, and charm flows.
Simply put, the market was more so susceptible to fundamental influences like divergent breadth.
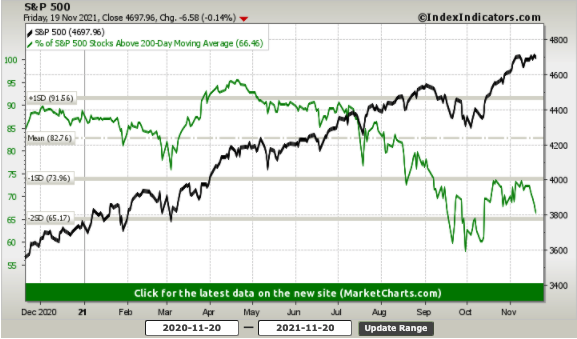
Graphic: Breadth metrics on Friday, November 19, 2021.
And so, demand for protection expanded.
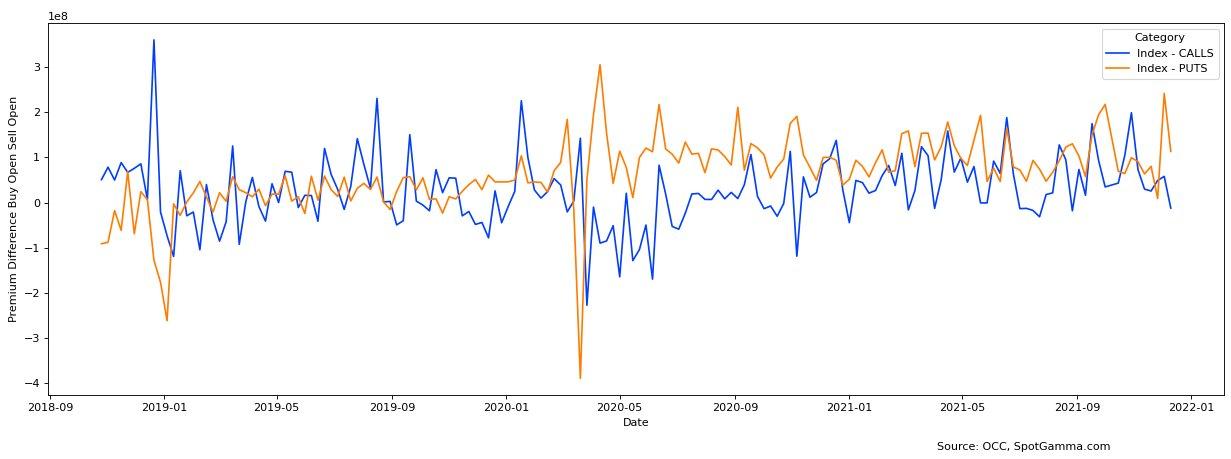
Volatility rose and participants – which we knew were underexposed to protection, as a result of the risk-on environment early November – at the index and individual stock level sought (extremely) short-dated, negative delta, convex put options that are very sensitive to direction.
Via the graphic below, one can better contextualize the demand for downside (put) protection.
Late last month, per TradingView data, put volumes surpassed their all-time highs previously attained during the early 2020 market sell-off.
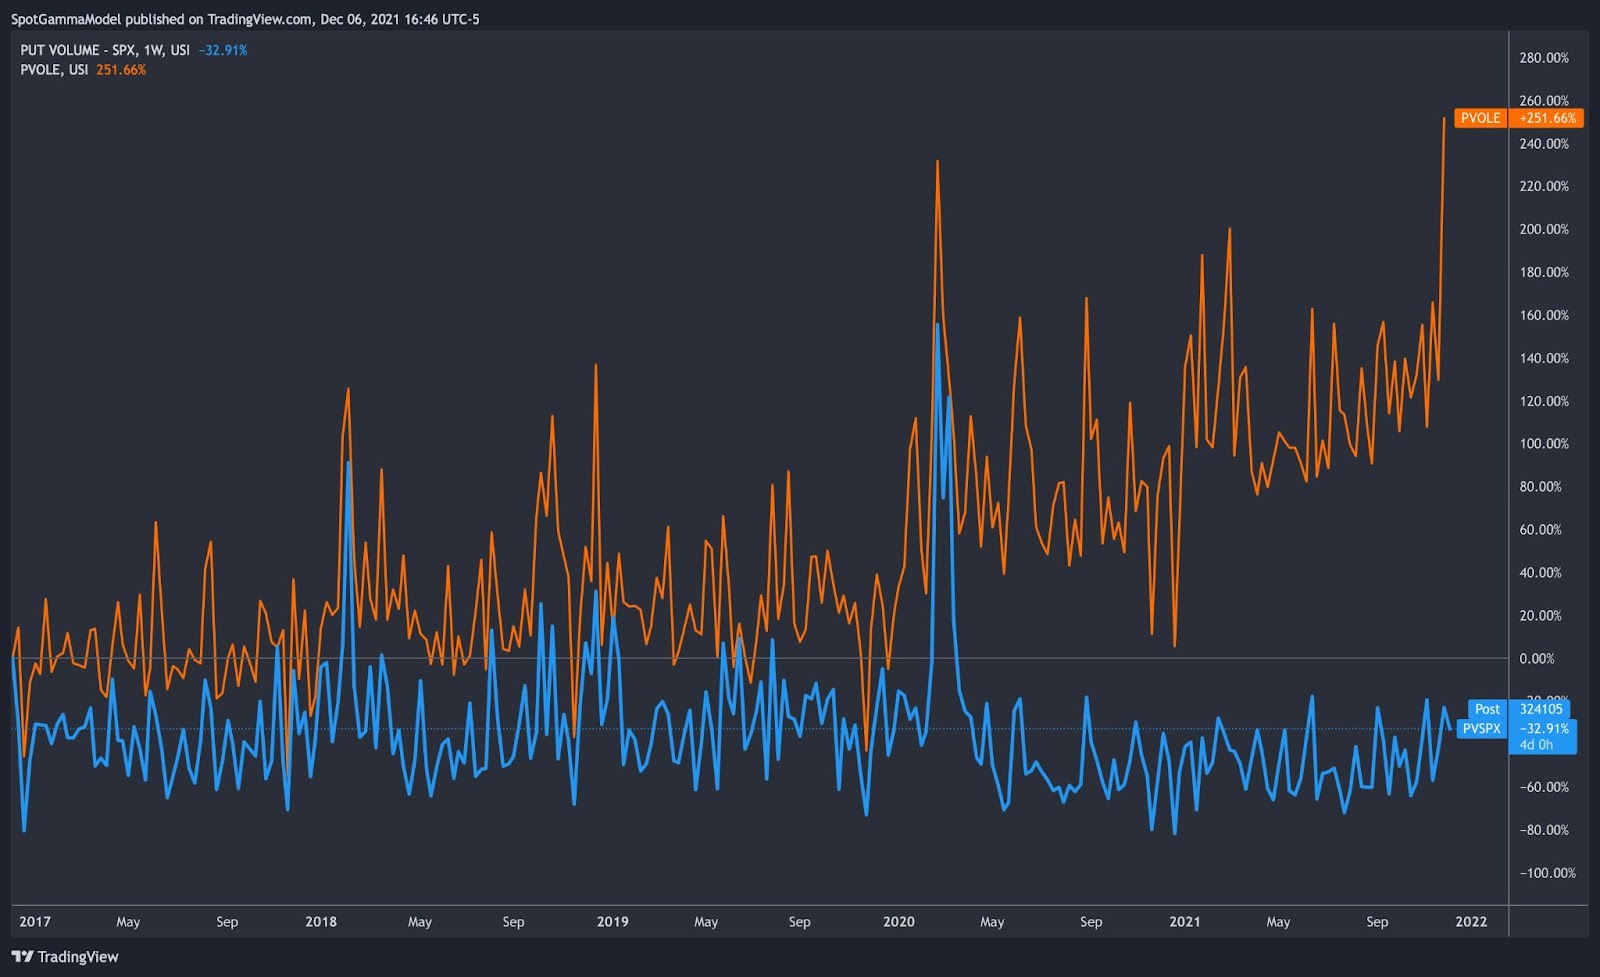
Graphic: Equity put volumes (orange) increase.
With the extreme relative weakness in less heavily-weighted constituents – some of which have the most to lose in a higher rate environment – feeding into S&P 500 positioning, the supportive gamma, vanna, and charm flows we spoke earlier about weren’t only taken away.
They flipped, pressuring stocks and indices.
What does “flipped” mean, you ask? Good question.
Being that there was an influx of customer demand for protection, liquidity was taken and implied volatility rose to compensate dealers’ exposure to increased risk.
As Newfound Research explains it well in their Liquidity Cascades paper, “a consistent feature of modern markets is rapidly declining liquidity depth during periods of market stress.”
One participant who may need to be taking liquidity during periods of market stress is a dealer.
“If markets suddenly sell-off, … the calls will move far out of the money and the puts will move closer to at-the-money. This means the dealer must now hedge the put position more actively,” Newfound adds. “This creates a potentially destabilizing force, acting as a divergent trade and further demanding liquidity when there is none.”
“This means that the derivative tail can wag the index dog.”
In the graphic of CME Group Inc (CME) Liquidity Tool immediately below, you can see book depth for the E-mini S&P 500 futures contract. Note the decline in book depth as the post-November OPEX sell-off ensued. This is the result of dealers taking liquidity to hedge their short-gamma exposure.
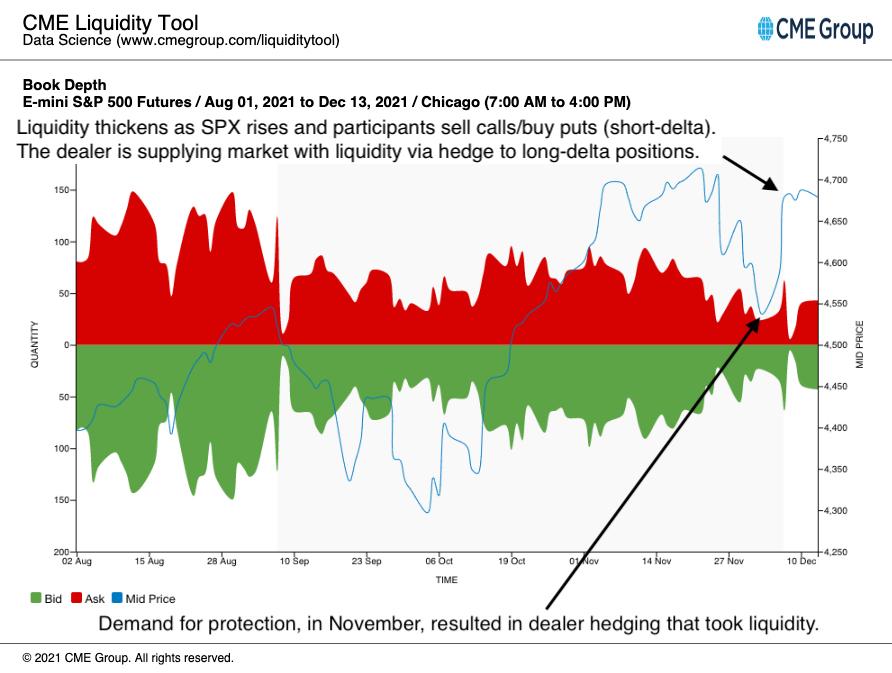
Graphic: Analysis of book depth for the E-mini S&P 500 futures contract, via CME Group Inc’s Liquidity Tool. Note that order book depth “in isolation is not the correct method to gauge liquidity,” it can help in roughly assessing participants’ demand/supply as volatility (and stress, by that token) increases.
So, in summation of the above, with participation turning heavy on the put side, long-gamma turned into short-gamma and dealer hedging exacerbated weakness; lower prices and higher volatility resulted in a mark up of the delta of put options dealers were net short.
What does mark up of the delta, mean?
Since dealers are to flatten their delta (pare down to zero), they sold stock and futures (i.e., added negative delta to hedge positive options delta tied to short put exposure).
Via the graphic below, one can see the implications of rising and declining volatility on the delta of a $4,600.00 put option. Imagine if you, the customer, bought the $4,600.00 put option when SPX was trading at $4,700.00 and 15% vol. At that point in time, you would have exposure to about -0.30 delta.
The customer has synthetic short exposure to the underlying.
The dealer, on the other side of the trade, has exposure to the +0.30 delta.
The dealer has synthetic long delta exposure they will hedge by selling 0.30 delta worth of the index.
However, should vol rise from 15% (blue) to 30% (red), the $4,600.00 put, while the SPX is trading at $4,700.00 will develop more extrinsic value (as a result of a higher probability the option develops intrinsic value at expiration).
At 30% vol, the customer will have exposure to -0.40 delta. The dealer will have exposure to +0.40 delta which they will hedge by selling .40 delta worth of the index.
As you can see, as volatility increases, so does a dealer’s exposure to long-delta risk which they hedge by selling more underlying.
See SpotGamma’s in-depth video on this dynamic by clicking here.
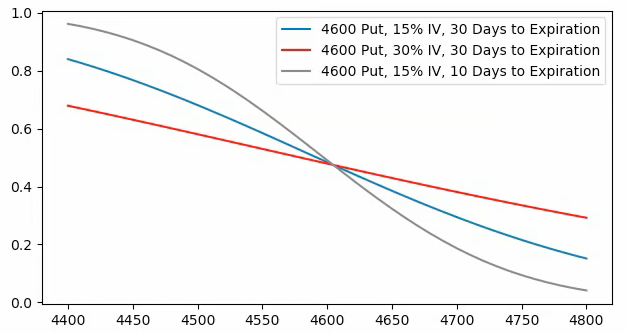
Graphic: When the factors of implied volatility and time change, hedging ratios change. SPX prices X-axis. Option delta Y-axis.
Tide Starts Shifting: Fast forward, after some positive news around COVID-19, among other things, participants marked the equity market higher, volatility declined, and short-dated protection was quickly monetized or expired.
As one can probably surmise via the above graphic, higher index prices, less time to expiry, and lower volatility lowered the dealers’ exposure to long-delta. As a result, dealers could cover some of their short-delta exposure.
The graphic below shows the compression of the VIX term structure.
This compression suggests positive dealer flows, as a result of volatility falling, helped stabilize the market and fuel a price rise into the week ending Dec 10, 2021.
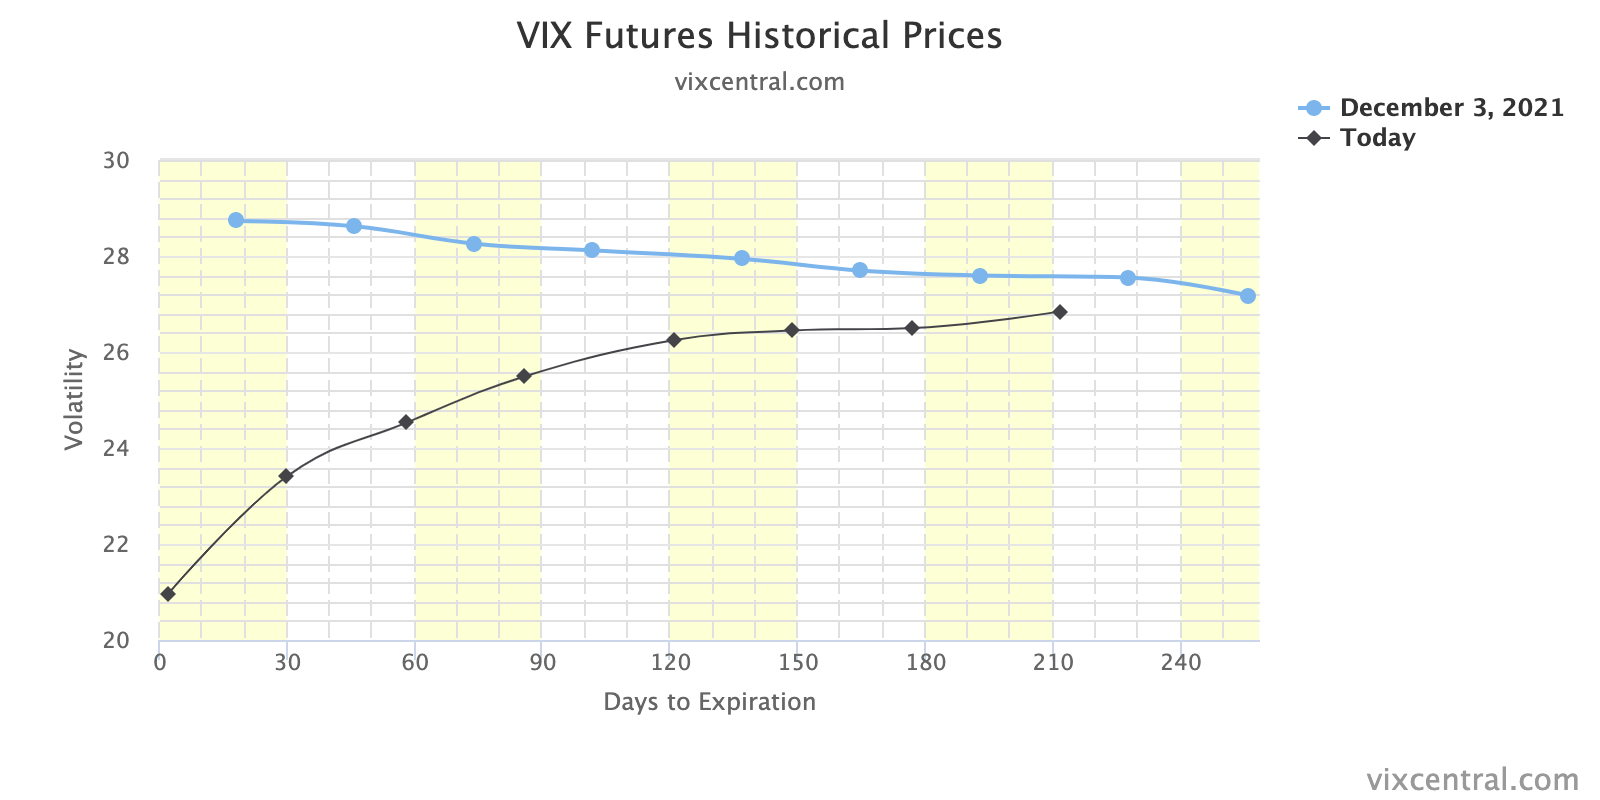
Graphic: VIX term structure Dec 3, 2021, versus Dec 17, 2021. The compression of this curve, especially at the front end, portends a change in dealer hedging ratios; positive vanna flows bolstered a reversal as dealers’ exposure to positive delta declined.
Participants Aren’t Convinced, Yet: Then, ahead of the Federal Open Market Committee (FOMC) decision and the Dec 17, 2021 put-heavy “quad-witching” OPEX, participants, at the S&P level, committed more capital to bets the market would not move much.
What does that mean? Basically, participants saw uncertainty with respect to monetary policy, among other things, as a reason to not continue discovering higher prices.
In expressing this opinion, as can be viewed via the graphic immediately below, customers sold-to-open upside (call) protection. As a result, customers were now short-delta.
The dealers, on the other side, took on long-delta inventory they would hedge by selling (buying) into strength (weakness), further cutting into volatility. Hi long-gamma, nice to see you again!
Graphic: Customers increased their exposure to short-delta. “Last week was about selling index calls,” SpotGamma’s Brent Kochuba said on Twitter. “This is likely why the $SPX stopped at $4,700.00.”
As Ambrus Group’s Kris Sidial best explained on Twitter, “vols were static in anticipation of the fed talk,” taking away from supportive flows (vanna) and promoting sideways trade.
Even on dips, participants committed capital to bets the market would not move much; they sold puts and bought calls.
Via the graphic of SpotGamma’s (beta) Hedging Impact of Real-Time Options (HIRO) product below, we see dealers hedging customer added long-delta exposure via long-delta futures hedges.
In other words, dealers bought futures to hedge their short-delta.
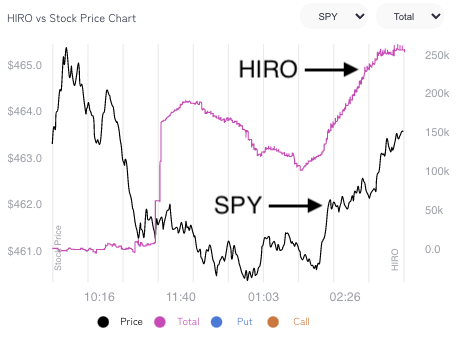
Graphic: SpotGamma’s Hedging Impact of Real-Time Options (HIRO) indicator, which is pink in color, was sideways to higher. This suggests positive options delta trades likely had dealers buying stock/futures on the Dec 14, 2021 decline.
Post-FOMC, Hedging Flows Tell The Story: Then, immediately after FOMC, there was an implosion in volatility.
That aforementioned out-of-the-money downside (put) protection demanded late Nov and early Dec quickly lost value and the dealer’s covering of short futures hedges supported a price rise.
“Some of the flow has felt like dealer hedging, very aggressive orders pulling liquidity to get filled,” Sidial added on Twitter.
With so little time to go to “quad-witching,” alongside data suggesting participants were still betting the market would not move much going into that event, SpotGamma subscribers knew dealers would be selling against their increased long-delta exposure, after that price rise.
The graphic below is that of SpotGamma’s vanna model which depicts the estimated delta hedging requirements for warehoused options positions. With changes in implied volatility, the model shifts.
Vanna, which is the change in delta for a given change in implied volatility (green line) is key, here.
The more positive delta notional is, the more futures dealers may have to sell to offset their options long delta exposure (as is viewed, below).
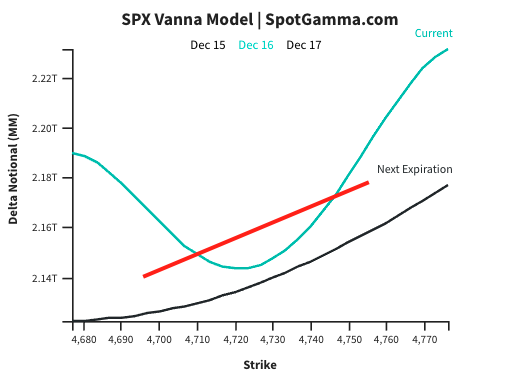
Graphic: Updated Dec 16, 2021. Tilt in the SpotGamma model suggested dealers would sell into strength.
As expected via SpotGamma data, dealers indeed promoted a reversion to pre-FOMC price levels while, at the same time, underlying weakness, especially in high-growth names, re-appeared. We think this weakness was compounded by large put positions in single stocks.
For instance, as can be viewed via SpotGamma’s EquityHub 1.0 below, new and existing demand for downside (put) protection in the stock resulted in accelerated dealer hedging flows which helped pressure shares of AMC to $20.00. The extra put interest is evident as the put gamma (orange line) is more negative than call gamma (blue line). Watch SpotGamma’s video on this dynamic by clicking here.
Graphic: Updated Dec 14, 2021. Shares of AMC stabilize at gamma–derived support near $20. Heavy put positioning resulted in an accelerated run between the $40 and $20 price levels.
So, with 50% of stocks having their largest – “put-heavy” – gamma position soon expiring in December, weakness had dealers selling aggressively against very short-dated, increasingly sensitive negative gamma positions.
Another example of a name with large put interest was the ARK Innovation ETF (ARKK), which had nearly 1.5B in notional put delta expiring on 12/17. The implication here is that options dealers may have held substantial short stock positions to offset this put exposure.
The graphic, below, shows how “put-heavy” this monthly OPEX for ARKK was, relative to other expiries.
Graphic: ARKK call vs put delta by expiration.
Moreover, with outstanding December options quickly decaying and dealers balancing their rapidly decreasing long-delta through Friday, the covering of static short hedges resulted in rallies across beaten-down products.
SpotGamma also anticipated that the expiration of these large put positions could create a rally in associated stocks, as dealers could buy back short hedges. Watch SpotGamma’s video on post-OPEX rally candidates by clicking here.
See the price action immediately to the left of the thick vertical white line.
Graphic: Updated Dec 17, 2021. Note the bid in growth and rate-sensitive names versus the more sticky, flatter- and positive-gamma S&P 500 (SPY).
Expectations: Coming into the week beginning Dec 20, after the “put-heavy” December monthly OPEX (one of the largest of the year), there was to be an expansion in realized volatility.
SpotGamma’s view was that this realized volatility would express itself in a move higher. This was a function of high implied volatility and the “clearing” of large options positions which removed short hedges.
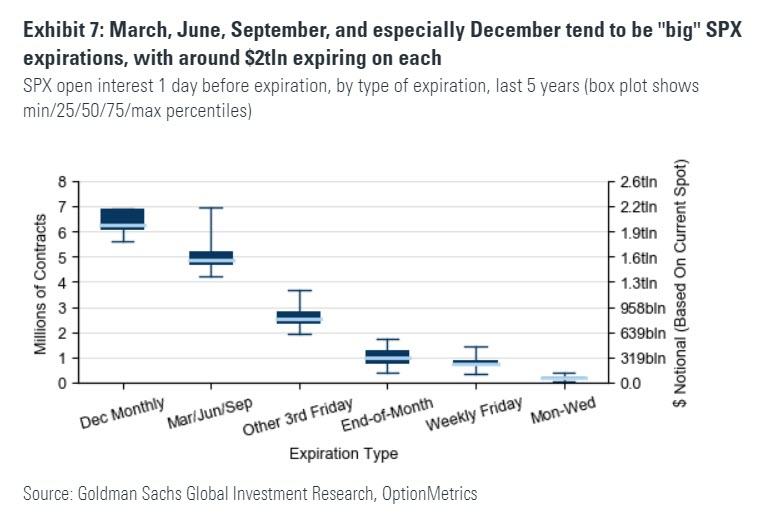
Graphic: Per Goldman Sachs Group (GS), “The ‘cleaning up’ of this positioning can in itself be a catalyst for heightened investor activity as they realign portfolios for the following months.”
That happened, early this week, Monday.
After a short drop did not solicit a resurgence in demand for protection (and volatility), as we saw heading into Dec 24, dealers had less long-delta to hedge against, bolstering a rally.
Considerations: A shift higher in our option wall metrics confirms a rally into (and beyond) end-of-year.
Such dynamic is supported by the pending management of massive S&P positions, and relentless, seasonally-aligned “passive buying support,” in the face of expectations there will be “the strongest quarterly nominal [economic] growth in more than three decades.”
Conversely, the same is true on the put side.
If there is a shift lower in our option wall metrics, alongside another round of weakness and higher volatility, markets will tend toward instability.
That latter dynamic aligns with Moody’s view that investor exposure to high leverage increases the speed with which volatility is realized.
“One potential catalyst would be an explosion in the value of margin accounts at brokers and dealers, which amounted to $595 billion in the second quarter, nearly double the pre-pandemic level. A drop in stock prices could trigger margin calls.”
Graphic: The “Biggest tail risk to SPX isn’t any macro data/virus/war but its own options market.”
Read Full Story »»»
 DiscoverGold
By: Spot Gamma | December 23, 2021
• Through an options market lens, the following text will add color to some recent market movements.
Context: At the index level, a dominant position among participants is the protective collar.
In reducing portfolio volatility, customers will sell upside (call) and buy downside (put) protection, against equity, a short-delta trade.
Should the underlying rise, the options part of that trade ought to lose money. It’s a hedge, after all.
The dealer, the counterparty on the other side of this trade, is long delta.
Should the underlying rise, the position ought to make money.

Graphic: Sergei Perfiliev’s, in an amazing write-up, helps us visualize the dealers’ exposure to customer long equity + put spread collar. Note the risk profile’s positive exposure direction.
All else equal, in balancing this exposure, the dealer will buy weakness and sell strength.
Why? To keep it simple, we assume the dealer has no interest in direction.
So, if the dealer will have more (less) exposure to positive delta as the underlying rises (falls), the dealer will sell (buy) underlying.
Now, when a position’s delta rises with stock or index price rises, gamma – how an option’s delta is expected to change given a change in the underlying – is added to delta.
When a position’s delta decreases with stock price falls, gamma is taken from delta.
So, in other words, gamma is “the potential delta-hedging of options positions.”
Moreover, when the aforementioned positioning, at the index level, is indeed dominant, the market is in what is often referred to as long-gamma.
Associated hedging (i.e., buying weakness, selling strength) of prevailing options positioning results in the addition of market liquidity and lower volatility.
As the risk of out-of-the-money customer protection developing intrinsic value declines (i.e., volatility and time trend to zero), dealers are long less delta, and therefore the unwind of hedges introduces positive flows (i.e., unwind of short delta hedges to long delta positions) that support lengthy sprints.
“I use this analogy of a jet,” Kai Volatility’s Cem Karsan once explained, referencing the factors – the change in the underlying price (gamma), implied volatility (vanna), and time (charm) – that impact an options exposure to directional risk or delta.
“As volatility is compressed, those jets will keep firing because … the hedging vanna and charm flows, and whatnot will push the markets higher.”
Context Applied: After the Nov 19 monthly options expiration (OPEX), the aforementioned “positive flows” were withdrawn on the removal/expiry of large options positions.
The market entered into a period of weakness, for lack of better phrasing, given a reduction in supportive gamma, vanna, and charm flows.
Simply put, the market was more so susceptible to fundamental influences like divergent breadth.

Graphic: Breadth metrics on Friday, November 19, 2021.
And so, demand for protection expanded.
Volatility rose and participants – which we knew were underexposed to protection, as a result of the risk-on environment early November – at the index and individual stock level sought (extremely) short-dated, negative delta, convex put options that are very sensitive to direction.
Via the graphic below, one can better contextualize the demand for downside (put) protection.
Late last month, per TradingView data, put volumes surpassed their all-time highs previously attained during the early 2020 market sell-off.

Graphic: Equity put volumes (orange) increase.
With the extreme relative weakness in less heavily-weighted constituents – some of which have the most to lose in a higher rate environment – feeding into S&P 500 positioning, the supportive gamma, vanna, and charm flows we spoke earlier about weren’t only taken away.
They flipped, pressuring stocks and indices.
What does “flipped” mean, you ask? Good question.
Being that there was an influx of customer demand for protection, liquidity was taken and implied volatility rose to compensate dealers’ exposure to increased risk.
As Newfound Research explains it well in their Liquidity Cascades paper, “a consistent feature of modern markets is rapidly declining liquidity depth during periods of market stress.”
One participant who may need to be taking liquidity during periods of market stress is a dealer.
“If markets suddenly sell-off, … the calls will move far out of the money and the puts will move closer to at-the-money. This means the dealer must now hedge the put position more actively,” Newfound adds. “This creates a potentially destabilizing force, acting as a divergent trade and further demanding liquidity when there is none.”
“This means that the derivative tail can wag the index dog.”
In the graphic of CME Group Inc (CME) Liquidity Tool immediately below, you can see book depth for the E-mini S&P 500 futures contract. Note the decline in book depth as the post-November OPEX sell-off ensued. This is the result of dealers taking liquidity to hedge their short-gamma exposure.

Graphic: Analysis of book depth for the E-mini S&P 500 futures contract, via CME Group Inc’s Liquidity Tool. Note that order book depth “in isolation is not the correct method to gauge liquidity,” it can help in roughly assessing participants’ demand/supply as volatility (and stress, by that token) increases.
So, in summation of the above, with participation turning heavy on the put side, long-gamma turned into short-gamma and dealer hedging exacerbated weakness; lower prices and higher volatility resulted in a mark up of the delta of put options dealers were net short.
What does mark up of the delta, mean?
Since dealers are to flatten their delta (pare down to zero), they sold stock and futures (i.e., added negative delta to hedge positive options delta tied to short put exposure).
Via the graphic below, one can see the implications of rising and declining volatility on the delta of a $4,600.00 put option. Imagine if you, the customer, bought the $4,600.00 put option when SPX was trading at $4,700.00 and 15% vol. At that point in time, you would have exposure to about -0.30 delta.
The customer has synthetic short exposure to the underlying.
The dealer, on the other side of the trade, has exposure to the +0.30 delta.
The dealer has synthetic long delta exposure they will hedge by selling 0.30 delta worth of the index.
However, should vol rise from 15% (blue) to 30% (red), the $4,600.00 put, while the SPX is trading at $4,700.00 will develop more extrinsic value (as a result of a higher probability the option develops intrinsic value at expiration).
At 30% vol, the customer will have exposure to -0.40 delta. The dealer will have exposure to +0.40 delta which they will hedge by selling .40 delta worth of the index.
As you can see, as volatility increases, so does a dealer’s exposure to long-delta risk which they hedge by selling more underlying.
See SpotGamma’s in-depth video on this dynamic by clicking here.

Graphic: When the factors of implied volatility and time change, hedging ratios change. SPX prices X-axis. Option delta Y-axis.
Tide Starts Shifting: Fast forward, after some positive news around COVID-19, among other things, participants marked the equity market higher, volatility declined, and short-dated protection was quickly monetized or expired.
As one can probably surmise via the above graphic, higher index prices, less time to expiry, and lower volatility lowered the dealers’ exposure to long-delta. As a result, dealers could cover some of their short-delta exposure.
The graphic below shows the compression of the VIX term structure.
This compression suggests positive dealer flows, as a result of volatility falling, helped stabilize the market and fuel a price rise into the week ending Dec 10, 2021.

Graphic: VIX term structure Dec 3, 2021, versus Dec 17, 2021. The compression of this curve, especially at the front end, portends a change in dealer hedging ratios; positive vanna flows bolstered a reversal as dealers’ exposure to positive delta declined.
Participants Aren’t Convinced, Yet: Then, ahead of the Federal Open Market Committee (FOMC) decision and the Dec 17, 2021 put-heavy “quad-witching” OPEX, participants, at the S&P level, committed more capital to bets the market would not move much.
What does that mean? Basically, participants saw uncertainty with respect to monetary policy, among other things, as a reason to not continue discovering higher prices.
In expressing this opinion, as can be viewed via the graphic immediately below, customers sold-to-open upside (call) protection. As a result, customers were now short-delta.
The dealers, on the other side, took on long-delta inventory they would hedge by selling (buying) into strength (weakness), further cutting into volatility. Hi long-gamma, nice to see you again!

Graphic: Customers increased their exposure to short-delta. “Last week was about selling index calls,” SpotGamma’s Brent Kochuba said on Twitter. “This is likely why the $SPX stopped at $4,700.00.”
As Ambrus Group’s Kris Sidial best explained on Twitter, “vols were static in anticipation of the fed talk,” taking away from supportive flows (vanna) and promoting sideways trade.
Even on dips, participants committed capital to bets the market would not move much; they sold puts and bought calls.
Via the graphic of SpotGamma’s (beta) Hedging Impact of Real-Time Options (HIRO) product below, we see dealers hedging customer added long-delta exposure via long-delta futures hedges.
In other words, dealers bought futures to hedge their short-delta.

Graphic: SpotGamma’s Hedging Impact of Real-Time Options (HIRO) indicator, which is pink in color, was sideways to higher. This suggests positive options delta trades likely had dealers buying stock/futures on the Dec 14, 2021 decline.
Post-FOMC, Hedging Flows Tell The Story: Then, immediately after FOMC, there was an implosion in volatility.
That aforementioned out-of-the-money downside (put) protection demanded late Nov and early Dec quickly lost value and the dealer’s covering of short futures hedges supported a price rise.
“Some of the flow has felt like dealer hedging, very aggressive orders pulling liquidity to get filled,” Sidial added on Twitter.
With so little time to go to “quad-witching,” alongside data suggesting participants were still betting the market would not move much going into that event, SpotGamma subscribers knew dealers would be selling against their increased long-delta exposure, after that price rise.
The graphic below is that of SpotGamma’s vanna model which depicts the estimated delta hedging requirements for warehoused options positions. With changes in implied volatility, the model shifts.
Vanna, which is the change in delta for a given change in implied volatility (green line) is key, here.
The more positive delta notional is, the more futures dealers may have to sell to offset their options long delta exposure (as is viewed, below).

Graphic: Updated Dec 16, 2021. Tilt in the SpotGamma model suggested dealers would sell into strength.
As expected via SpotGamma data, dealers indeed promoted a reversion to pre-FOMC price levels while, at the same time, underlying weakness, especially in high-growth names, re-appeared. We think this weakness was compounded by large put positions in single stocks.
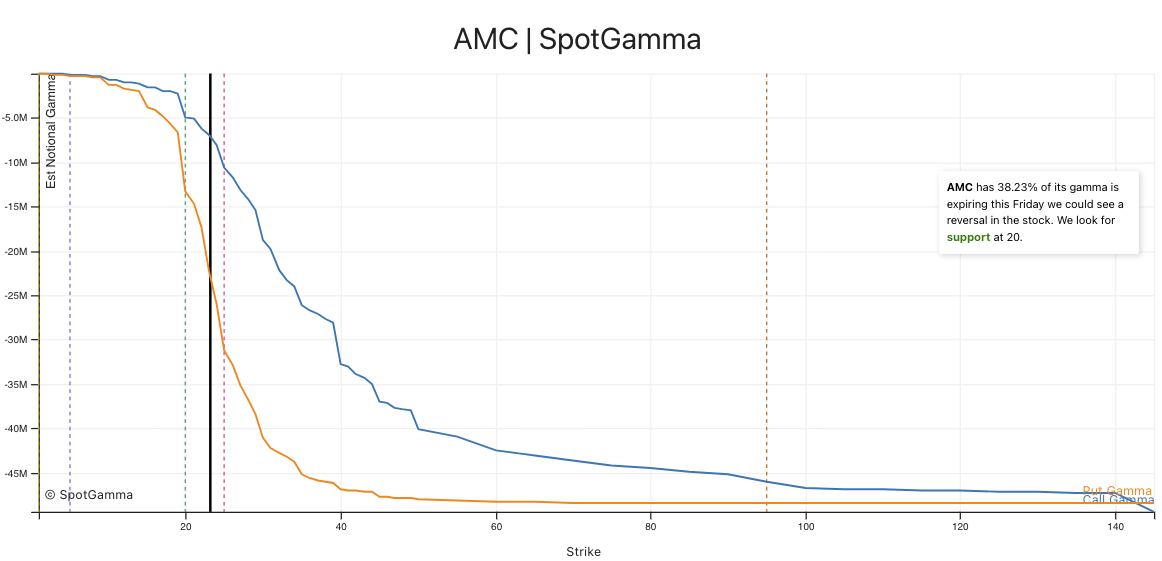
For instance, as can be viewed via SpotGamma’s EquityHub 1.0 below, new and existing demand for downside (put) protection in the stock resulted in accelerated dealer hedging flows which helped pressure shares of AMC to $20.00. The extra put interest is evident as the put gamma (orange line) is more negative than call gamma (blue line). Watch SpotGamma’s video on this dynamic by clicking here.

Graphic: Updated Dec 14, 2021. Shares of AMC stabilize at gamma–derived support near $20. Heavy put positioning resulted in an accelerated run between the $40 and $20 price levels.
So, with 50% of stocks having their largest – “put-heavy” – gamma position soon expiring in December, weakness had dealers selling aggressively against very short-dated, increasingly sensitive negative gamma positions.
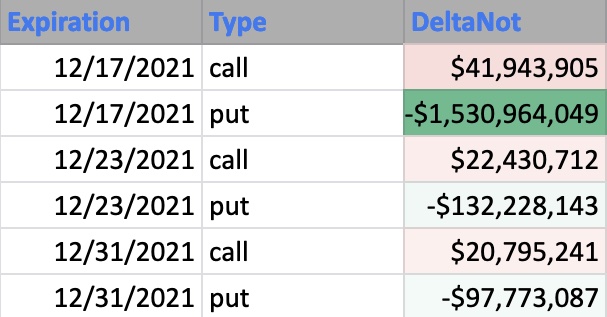
Another example of a name with large put interest was the ARK Innovation ETF (ARKK), which had nearly 1.5B in notional put delta expiring on 12/17. The implication here is that options dealers may have held substantial short stock positions to offset this put exposure.
The graphic, below, shows how “put-heavy” this monthly OPEX for ARKK was, relative to other expiries.

Graphic: ARKK call vs put delta by expiration.
Moreover, with outstanding December options quickly decaying and dealers balancing their rapidly decreasing long-delta through Friday, the covering of static short hedges resulted in rallies across beaten-down products.
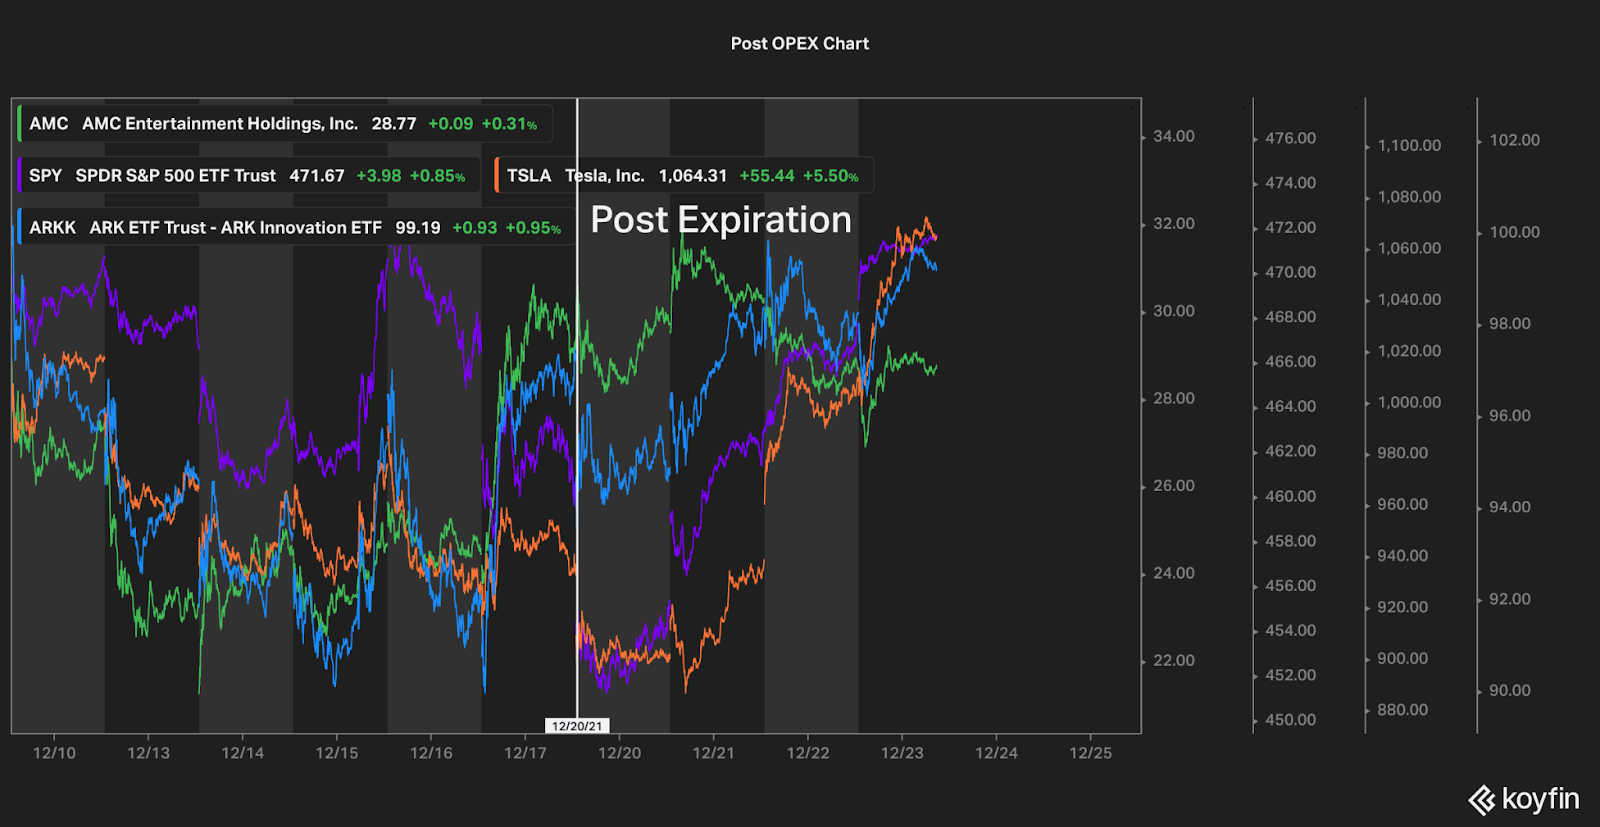
SpotGamma also anticipated that the expiration of these large put positions could create a rally in associated stocks, as dealers could buy back short hedges. Watch SpotGamma’s video on post-OPEX rally candidates by clicking here.
See the price action immediately to the left of the thick vertical white line.

Graphic: Updated Dec 17, 2021. Note the bid in growth and rate-sensitive names versus the more sticky, flatter- and positive-gamma S&P 500 (SPY).
Expectations: Coming into the week beginning Dec 20, after the “put-heavy” December monthly OPEX (one of the largest of the year), there was to be an expansion in realized volatility.
SpotGamma’s view was that this realized volatility would express itself in a move higher. This was a function of high implied volatility and the “clearing” of large options positions which removed short hedges.

Graphic: Per Goldman Sachs Group (GS), “The ‘cleaning up’ of this positioning can in itself be a catalyst for heightened investor activity as they realign portfolios for the following months.”
That happened, early this week, Monday.
After a short drop did not solicit a resurgence in demand for protection (and volatility), as we saw heading into Dec 24, dealers had less long-delta to hedge against, bolstering a rally.
Considerations: A shift higher in our option wall metrics confirms a rally into (and beyond) end-of-year.
Such dynamic is supported by the pending management of massive S&P positions, and relentless, seasonally-aligned “passive buying support,” in the face of expectations there will be “the strongest quarterly nominal [economic] growth in more than three decades.”
Conversely, the same is true on the put side.
If there is a shift lower in our option wall metrics, alongside another round of weakness and higher volatility, markets will tend toward instability.
That latter dynamic aligns with Moody’s view that investor exposure to high leverage increases the speed with which volatility is realized.
“One potential catalyst would be an explosion in the value of margin accounts at brokers and dealers, which amounted to $595 billion in the second quarter, nearly double the pre-pandemic level. A drop in stock prices could trigger margin calls.”

Graphic: The “Biggest tail risk to SPX isn’t any macro data/virus/war but its own options market.”
Read Full Story »»»
 DiscoverGold
Information posted to this board is not meant to suggest any specific action, but to point out the technical signs that can help our readers make their own specific decisions. Caveat emptor!
• DiscoverGold
Join the InvestorsHub Community
Register for free to join our community of investors and share your ideas. You will also get access to streaming quotes, interactive charts, trades, portfolio, live options flow and more tools.

