


| Followers | 689 |
| Posts | 143817 |
| Boards Moderated | 35 |
| Alias Born | 03/10/2004 |
Sunday, December 19, 2021 11:00:17 AM
Market Advances End In Exhaustion
By: Mark J Lundeen | December 19, 2021
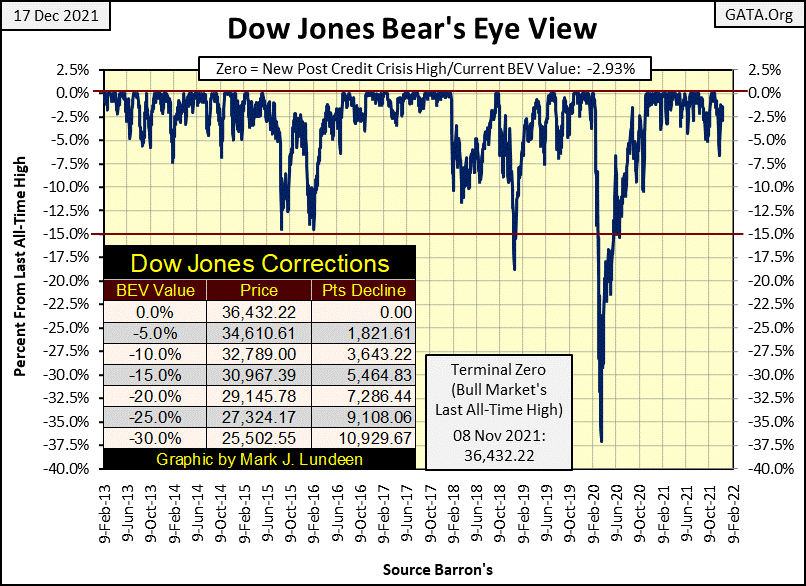
Looking at the Dow Jones’ BEV chart below, specifically the cluster of BEV Zeros for the post March 2020 flash-crash advance; slowly but surely things are changing. It’s been over a month since our last BEV Zero (November 8th). That plus the bulls have been careless about defending the Dow Jones’ BEV -5% line. This is the line that separates daily closes, those in or out of scoring position. BEV values just short of a new all-time high, down to -4.99% from an all-time high are in scoring position, a position from where it’s easy for an index to advance up to a new all-time high.
None of this indicates the post March 2020 flash-crash advance is over. But this advance has been going on for the past twenty-one months, and advances like this end in exhaustion. The bulls, though still running wild and free, are increasingly looking exhausted.
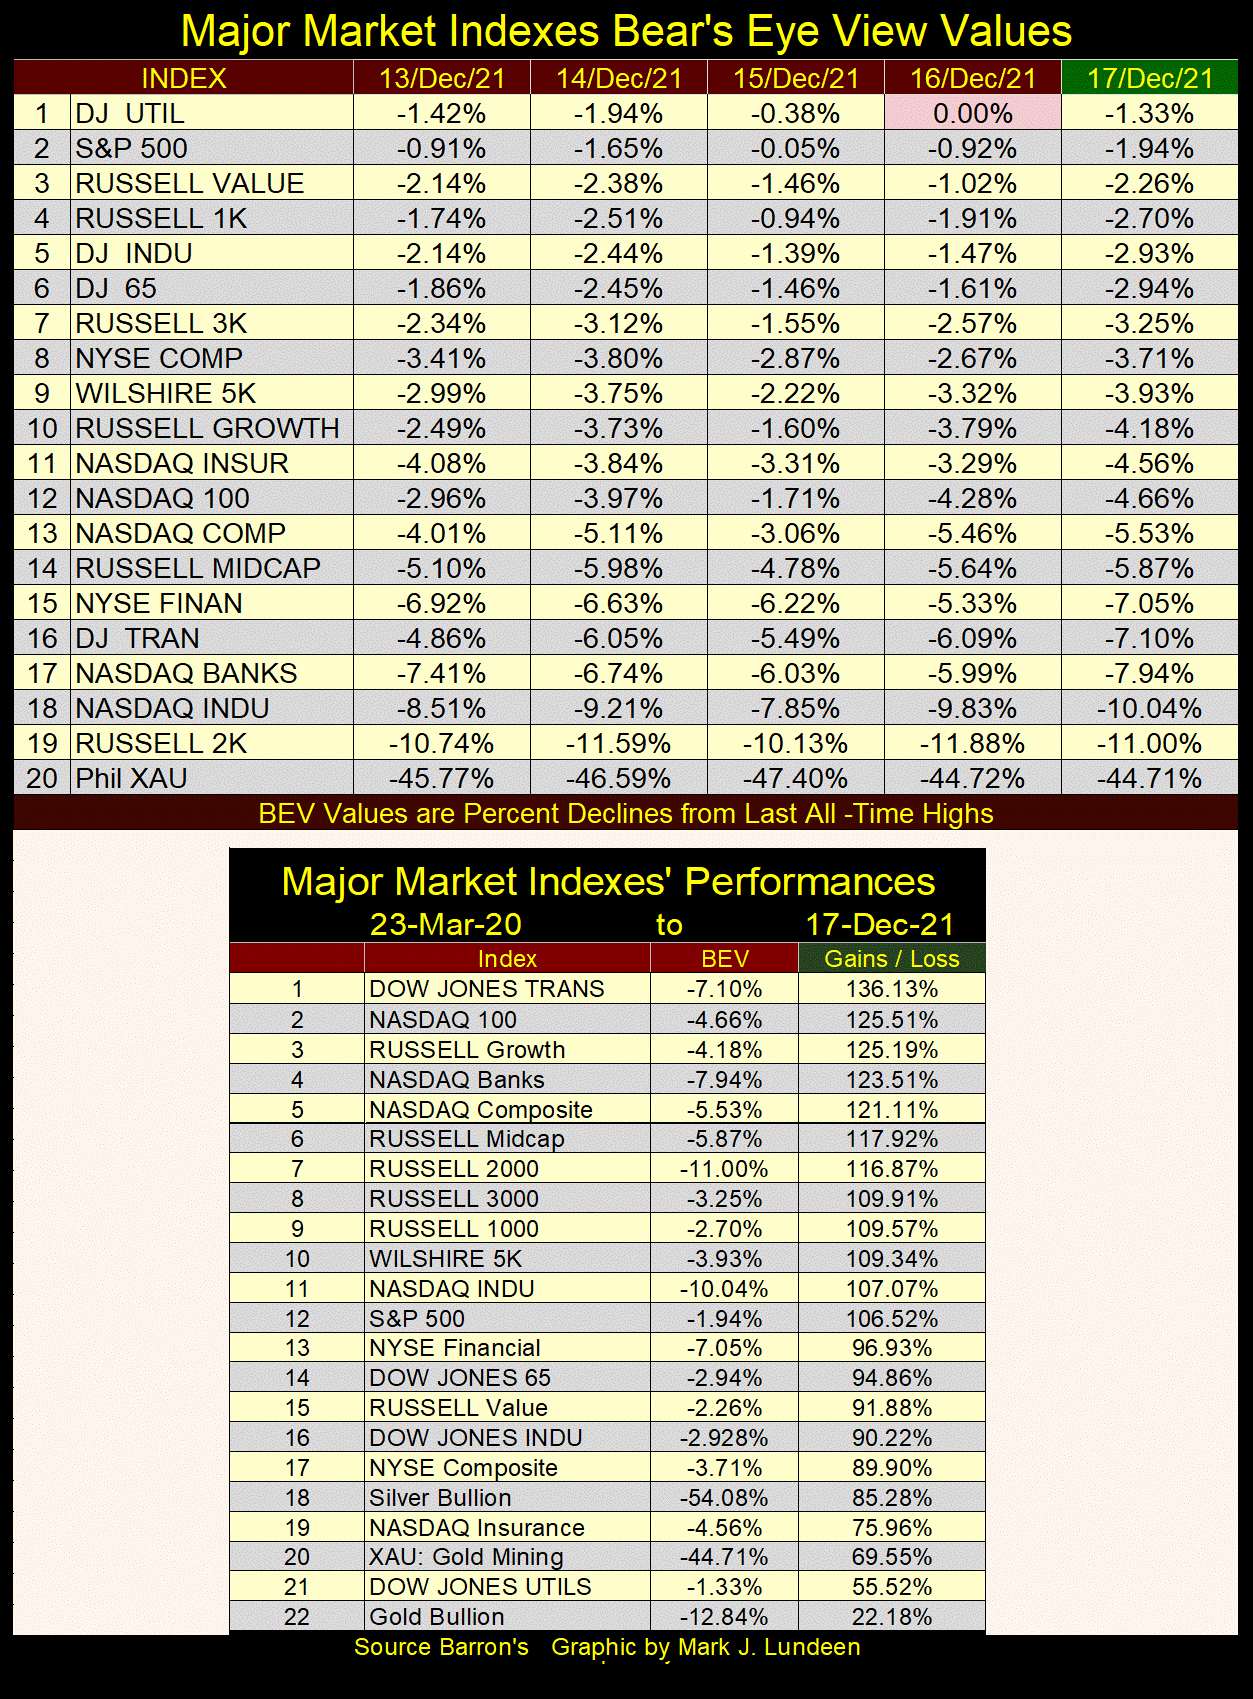
Looking at my table for the major-market indexes’ Bear’s Eye View values (below), last week saw only one new all-time high for the entire week: the Dow Jones Utilities Average (#1). Last week the sole new all-time high was the S&P 500. This week the S&P 500 came close to making another BEV Zero on Wednesday (BEV -0.05%), but closed the week with a BEV of -1.94%.
The bulls couldn’t come up with another 0.05% to close on Wednesday at a new all-time high? What’s the problem here? Exhaustion?
I can’t blame the bulls for being tired. Look at the advances from their 23 March 2020 bottoms in the table above, most of them are in the triple digits. Can they keep this up, and how much more do investors expect from these tried, old cows?
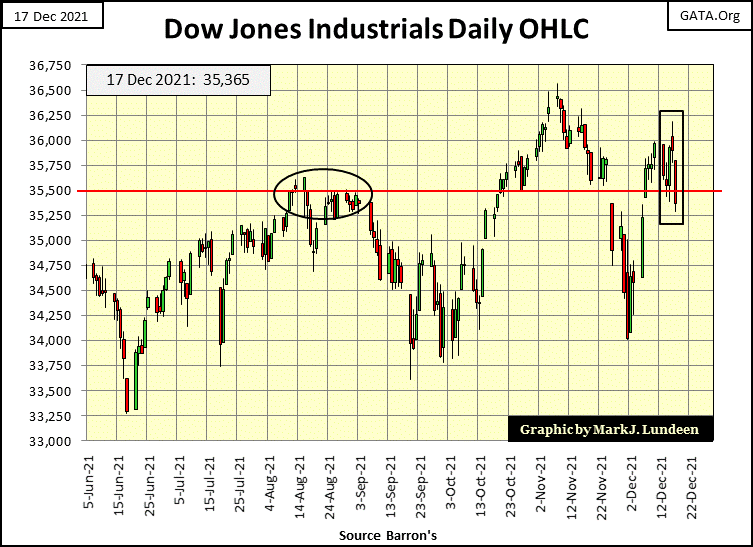
One problem that old age brings is confusion, and apparently confusion ruled the Dow Jones this past week (black rectangle / chart below). Monday and Tuesday the Dow Jones is down big, then on Wednesday it’s up big. Thursday and Friday the cows began running downhill again, closing the week below the Dow Jones support line at 35,500.
Looking at last week’s trading inside the box below leaves me confused too. I don’t care to speculate whether the Dow Jones will be up or down by the close of next week’s trading.
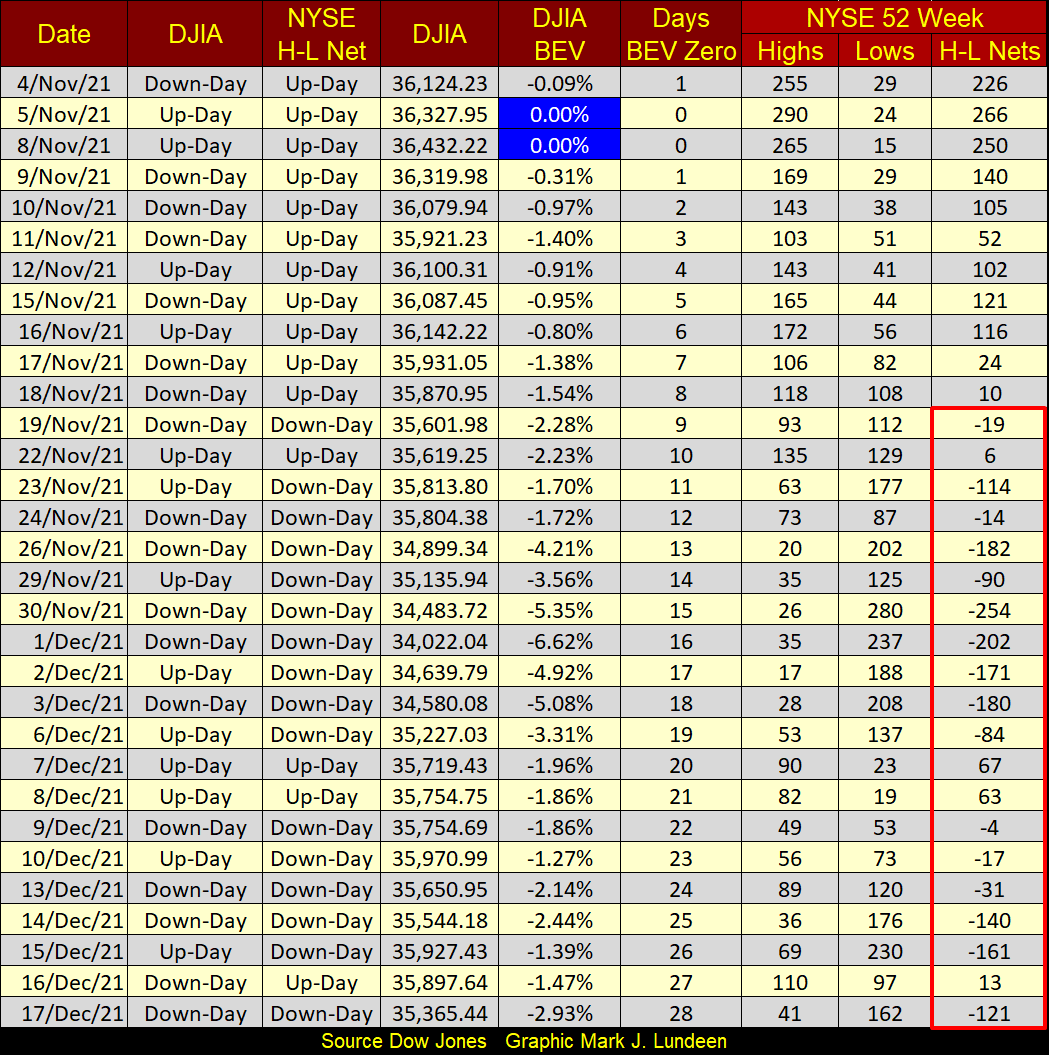
Looking at the 52Wk Highs and Lows for the NYSE in the table below provides no comfort for the bulls. In the H-L Nets column, since November 19th 52Wk Lows have dominated 52Wk Highs. I had to go back to the March 2020 flash crash to find a similar month, with this many negative daily H-L Nets. Though in March 2020, daily negative nets of over 2000 were common. So far, our most negative daily 52Wk H-L net was 254 on November 30th.
So, what now follows this week’s trading? Looking at the weak technical indicators shown above, I’m feeling a bit bearish. But keep in mind, where for the past twenty-one months all these BEV Zeros and triple digit percentage advances have come from; the FOMC. With their ability to inflate the financial system with as many trillions of dollars as they care to, it’s hard to get very bearish on this market. This week, they “injected” an additional $51 billion into the financial system (see chart below). If they felt they had to, they could “inject” over $400 billion into the market in a single week, as they did in March 2020 below.
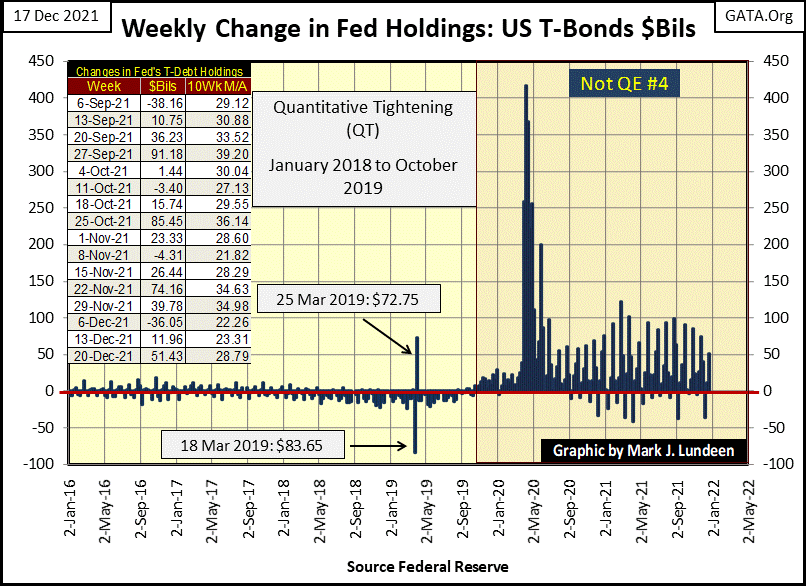
Will the FOMC continue “injecting” inflation into the financial system from now on, until California falls into the Pacific Ocean? No, though they could. The problem the idiot savants at the FOMC are having is since the Market’s March 2020 lows, “liquidity injected” into the financial system is now also flowing into commodity prices. That isn’t bullish for the stock or the bond market. In fact, rising CPI inflation is like unleashing a terminator on Wall Street.
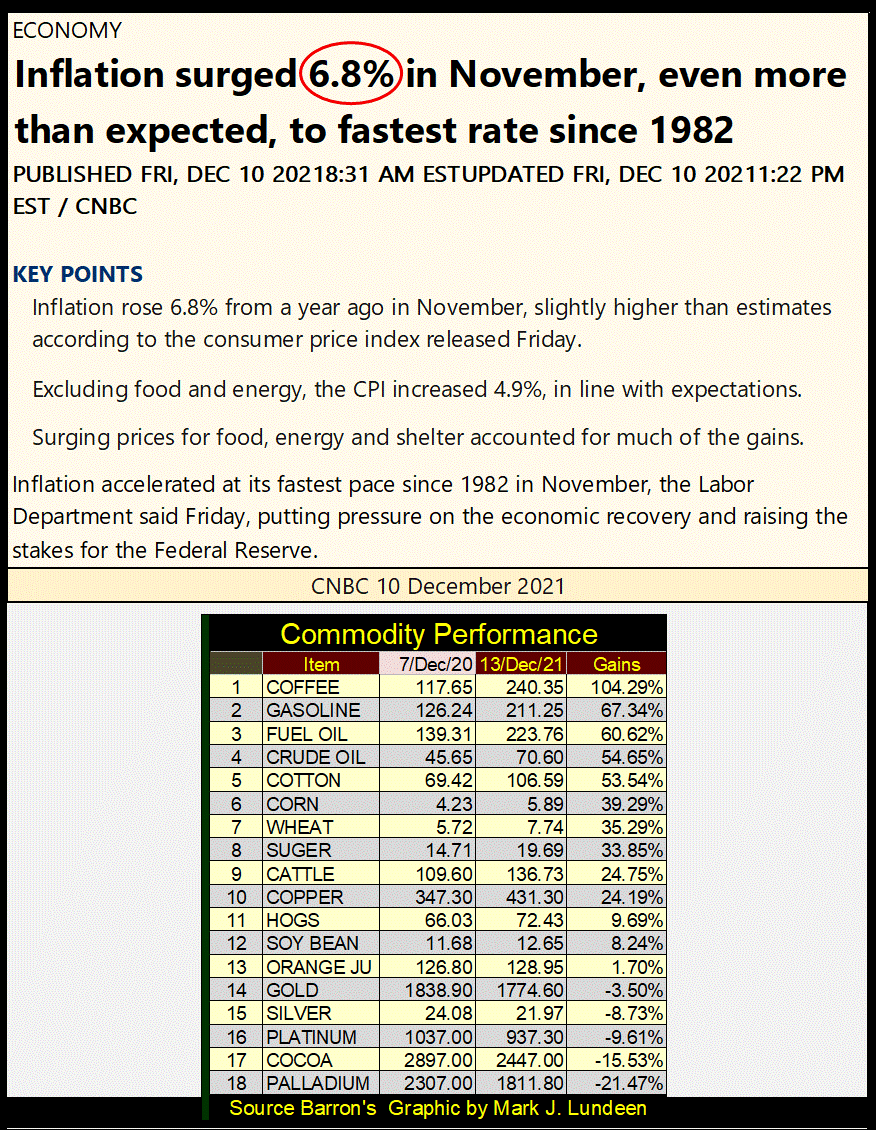
This week the financial media had some big news on inflation. CPI was up 6.8% from November 2020 to 2021. But such numbers concerning inflation are government manufactured, and become preposterous when closer scrutiny is applied.
Here’s the CNBC report on this story from the US Department of Labor, a shocking rate of inflation of 6.8%. But when this 6.8% rate of inflation is compared to the commodity price increases seen below, this government report of inflation begins looking rather bogus.
https://www.cnbc.com/2021/12/10/consumer-price-index-november-2021.html
The Department of Labor’s reply to any question concerning their numbers, would be that people like me don’t understand how to properly calculate something as complicated as the rate of inflation in a very complicated mechanism, such as the American economy.
To which I would reply; I don’t care how the Labor Department calculates their statistics on inflation, as the end product of their labor obviously has no relevance on the reality of my life.
What I care about is, in the past year the prices I pay for energy, food and everything else has increased much more than the Labor Department’s 6.8%. I wouldn’t be surprised if in the past year, my actual cost-of-living was actually up by 15% or more. I’m sure that is true for everyone, even for the “journalists” who write copy for CNBC’s stories on inflation, and their “editors” who, for reasons best known to themselves, never question anything from a government source, no matter how absurd, such as the above 6.8% inflation rate.
The danger high rates of inflation present to “monetary policy”, as executed by the FOMC, is that at some point, a selling panic in the bond market will materialize.
Bonds, mortgages, consumer debt, any form of debt is traded. Which means the price of debt is fixed by how much buyers of debt are willing to pay.
When the current high rate of inflation is finally integrated into the psyche of the debt buyers, buyers of debt will then refuse to buy debt yielding 1%, when that debt’s principle is being eroded by an annual inflation rate of 6.8%, or more. At this point, the sellers of debt will be forced to discount their debt, until its current yield increases to something that attracts buyers.
Come this new paradigm in the debt market, there is nothing the FOMC can do to reverse it. Though the idiot savants may attempt to “stabilize” the debt market’s valuations by entering the market, and do something no one else is willing to do; buy overvalued debt at full price, and in sufficient volume to “stabilize” the debt markets. They’ve done this before. See the four QEs plotted in the chart below.
Also, historically the stock market becomes a bad market to be in when the debt market is selling off. So, unless the idiot savants at the FOMC intend to “stabilize market valuations” in both the bond and stock markets, by becoming the buyer of last resort during a bear-market selling panic on Wall Street, market valuations are going to deflate.
Currently the Federal Reserve’s balance sheet is $8.67 trillion dollars. How many multiples of $8.67 trillion dollars would it take to “stabilize market valuations” in the next market sell off?
In the chart below we see the inflationary “injections” of three QEs needed to “stabilize” the financial system during the sub-prime mortgage crisis. The Not QE#4 was what Fed Chairman Powell had to “inject” into the financial system to “stabilize” the financial system during the March 2020 flash crash. The FOMC’s Not QE#4 continues to this day.
Read Full Story »»»
 DiscoverGold
By: Mark J Lundeen | December 19, 2021
Looking at the Dow Jones’ BEV chart below, specifically the cluster of BEV Zeros for the post March 2020 flash-crash advance; slowly but surely things are changing. It’s been over a month since our last BEV Zero (November 8th). That plus the bulls have been careless about defending the Dow Jones’ BEV -5% line. This is the line that separates daily closes, those in or out of scoring position. BEV values just short of a new all-time high, down to -4.99% from an all-time high are in scoring position, a position from where it’s easy for an index to advance up to a new all-time high.
None of this indicates the post March 2020 flash-crash advance is over. But this advance has been going on for the past twenty-one months, and advances like this end in exhaustion. The bulls, though still running wild and free, are increasingly looking exhausted.

Looking at my table for the major-market indexes’ Bear’s Eye View values (below), last week saw only one new all-time high for the entire week: the Dow Jones Utilities Average (#1). Last week the sole new all-time high was the S&P 500. This week the S&P 500 came close to making another BEV Zero on Wednesday (BEV -0.05%), but closed the week with a BEV of -1.94%.
The bulls couldn’t come up with another 0.05% to close on Wednesday at a new all-time high? What’s the problem here? Exhaustion?

I can’t blame the bulls for being tired. Look at the advances from their 23 March 2020 bottoms in the table above, most of them are in the triple digits. Can they keep this up, and how much more do investors expect from these tried, old cows?
One problem that old age brings is confusion, and apparently confusion ruled the Dow Jones this past week (black rectangle / chart below). Monday and Tuesday the Dow Jones is down big, then on Wednesday it’s up big. Thursday and Friday the cows began running downhill again, closing the week below the Dow Jones support line at 35,500.
Looking at last week’s trading inside the box below leaves me confused too. I don’t care to speculate whether the Dow Jones will be up or down by the close of next week’s trading.

Looking at the 52Wk Highs and Lows for the NYSE in the table below provides no comfort for the bulls. In the H-L Nets column, since November 19th 52Wk Lows have dominated 52Wk Highs. I had to go back to the March 2020 flash crash to find a similar month, with this many negative daily H-L Nets. Though in March 2020, daily negative nets of over 2000 were common. So far, our most negative daily 52Wk H-L net was 254 on November 30th.

So, what now follows this week’s trading? Looking at the weak technical indicators shown above, I’m feeling a bit bearish. But keep in mind, where for the past twenty-one months all these BEV Zeros and triple digit percentage advances have come from; the FOMC. With their ability to inflate the financial system with as many trillions of dollars as they care to, it’s hard to get very bearish on this market. This week, they “injected” an additional $51 billion into the financial system (see chart below). If they felt they had to, they could “inject” over $400 billion into the market in a single week, as they did in March 2020 below.

Will the FOMC continue “injecting” inflation into the financial system from now on, until California falls into the Pacific Ocean? No, though they could. The problem the idiot savants at the FOMC are having is since the Market’s March 2020 lows, “liquidity injected” into the financial system is now also flowing into commodity prices. That isn’t bullish for the stock or the bond market. In fact, rising CPI inflation is like unleashing a terminator on Wall Street.
This week the financial media had some big news on inflation. CPI was up 6.8% from November 2020 to 2021. But such numbers concerning inflation are government manufactured, and become preposterous when closer scrutiny is applied.
Here’s the CNBC report on this story from the US Department of Labor, a shocking rate of inflation of 6.8%. But when this 6.8% rate of inflation is compared to the commodity price increases seen below, this government report of inflation begins looking rather bogus.

https://www.cnbc.com/2021/12/10/consumer-price-index-november-2021.html
The Department of Labor’s reply to any question concerning their numbers, would be that people like me don’t understand how to properly calculate something as complicated as the rate of inflation in a very complicated mechanism, such as the American economy.
To which I would reply; I don’t care how the Labor Department calculates their statistics on inflation, as the end product of their labor obviously has no relevance on the reality of my life.
What I care about is, in the past year the prices I pay for energy, food and everything else has increased much more than the Labor Department’s 6.8%. I wouldn’t be surprised if in the past year, my actual cost-of-living was actually up by 15% or more. I’m sure that is true for everyone, even for the “journalists” who write copy for CNBC’s stories on inflation, and their “editors” who, for reasons best known to themselves, never question anything from a government source, no matter how absurd, such as the above 6.8% inflation rate.
The danger high rates of inflation present to “monetary policy”, as executed by the FOMC, is that at some point, a selling panic in the bond market will materialize.
Bonds, mortgages, consumer debt, any form of debt is traded. Which means the price of debt is fixed by how much buyers of debt are willing to pay.
When the current high rate of inflation is finally integrated into the psyche of the debt buyers, buyers of debt will then refuse to buy debt yielding 1%, when that debt’s principle is being eroded by an annual inflation rate of 6.8%, or more. At this point, the sellers of debt will be forced to discount their debt, until its current yield increases to something that attracts buyers.
Come this new paradigm in the debt market, there is nothing the FOMC can do to reverse it. Though the idiot savants may attempt to “stabilize” the debt market’s valuations by entering the market, and do something no one else is willing to do; buy overvalued debt at full price, and in sufficient volume to “stabilize” the debt markets. They’ve done this before. See the four QEs plotted in the chart below.
Also, historically the stock market becomes a bad market to be in when the debt market is selling off. So, unless the idiot savants at the FOMC intend to “stabilize market valuations” in both the bond and stock markets, by becoming the buyer of last resort during a bear-market selling panic on Wall Street, market valuations are going to deflate.
Currently the Federal Reserve’s balance sheet is $8.67 trillion dollars. How many multiples of $8.67 trillion dollars would it take to “stabilize market valuations” in the next market sell off?
In the chart below we see the inflationary “injections” of three QEs needed to “stabilize” the financial system during the sub-prime mortgage crisis. The Not QE#4 was what Fed Chairman Powell had to “inject” into the financial system to “stabilize” the financial system during the March 2020 flash crash. The FOMC’s Not QE#4 continues to this day.
Read Full Story »»»
 DiscoverGold
Information posted to this board is not meant to suggest any specific action, but to point out the technical signs that can help our readers make their own specific decisions. Caveat emptor!
• DiscoverGold
Join the InvestorsHub Community
Register for free to join our community of investors and share your ideas. You will also get access to streaming quotes, interactive charts, trades, portfolio, live options flow and more tools.

