Wednesday, November 24, 2021 2:56:16 AM
DPLS - Rated A+ by Wallet Investor
https://walletinvestor.com/stock-forecast/stocks-under-50-cents
https://walletinvestor.com/stock-forecast/dpls-stock-prediction
__________________________________
https://stockinvest.us/stock/DPLS
http://www.allotcbb.com/quote.php?symbol=DPLS
https://otcbb.swingtradebot.com/equities/DPLS:OTC
_________________________________________________________________
_________________________________________________________________
I'll Alert you of stocks to Buy,
before the Run happens !
_________________________________________________________________
DPLS Security Details
Share Structure
Market Value1...........$469,299,925 a/o Nov 23, 2021
Authorized Shares..20,000,000,000 a/o Nov 12, 2021
Outstanding Shares..4,976,669,407 a/o Nov 12, 2021
Restricted.......................37,448,333 a/o Nov 12, 2021
Unrestricted...............4,939,221,074 a/o Nov 12, 2021
Held at DTC................Not Available
Float..........................Not Available
Par Value 0.01
FORM S-3
07/12/2021
https://www.otcmarkets.com/filing/html?id=15086465&guid=uXFkkFkZw4vFt8h
https://www.otcmarkets.com/stock/DPLS/security
https://www.otcmarkets.com/stock/DPLS/news
https://www.otcmarkets.com/stock/DPLS/disclosure
________________________________________________________________
How Targets are Calculated
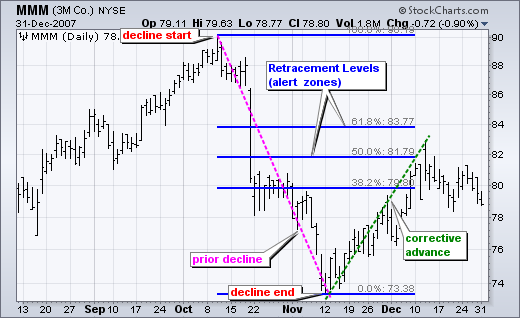
Fibonacci Numbers and Retrace Targets: Explained
________________________________________________________________
Fibonacci Numbers
http://www.stockta.com/cgi-bin/school.pl?page=fib
Fibonacci Retracements
* Golden 61.8% Retracements
* Moderate 38.2% Retracements
* Common 38.2% Retracements
Fibonacci Retracements
http://stockcharts.com/school/doku.php?id=chart_school:chart_analysis:fibonacci_retracemen
________________________________________________________________
Fibonacci Numbers
are commonly used in Technical Analysis
with or without a knowledge of Elliot Wave Analysis
to determine potential support, resistance,
and price objectives.
The most popular Fibonacci Retracements are
61.8% and 38.2%
61.8% retracements
imply a new trend is establishing itself.
38.2% retracements
usually imply that the prior trend will continue
38.2% retracements
are considered natural retracements in a healthy trend.
Fibonacci Retracements
can be applied after a decline
to forecast the length of a counter-trend bounce.
________________________________________________________________
The 50% retracement is not based on a Fibonacci number.
Instead, this number stems from Dow Theory's assertion
that the Averages often retrace half their prior move.
50% retracement
implies indecision.
________________________________________________________________
________________________________________________________________
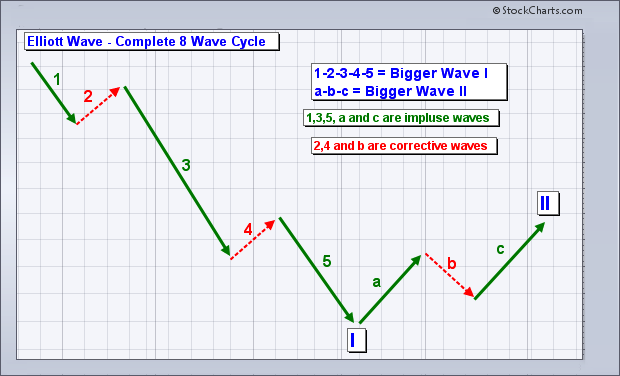
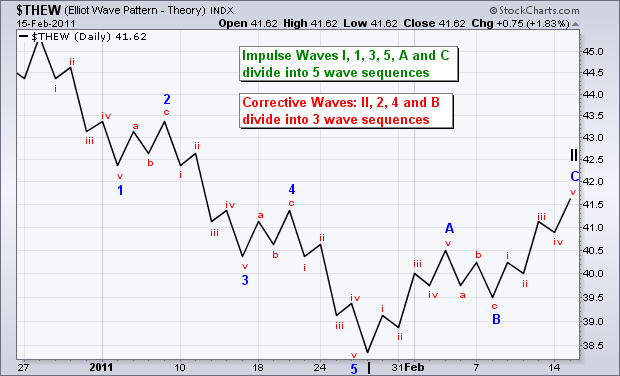
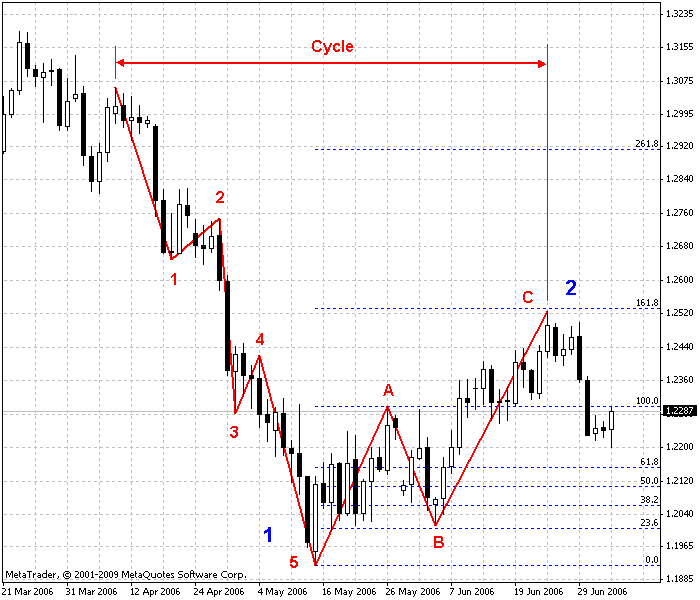
Buy after an Elliott Wave 5-Wave Decline
https://investorshub.advfn.com/boards/read_msg.aspx?message_id=163415264
https://investorshub.advfn.com/boards/read_msg.aspx?message_id=158251702
https://investorshub.advfn.com/boards/read_msg.aspx?message_id=158231374
_________________________________________________________________
________________________________________________________________
Buy after an Elliott Wave 5-Wave Decline
https://investorshub.advfn.com/boards/read_msg.aspx?message_id=163415264
https://investorshub.advfn.com/boards/read_msg.aspx?message_id=158251702
https://investorshub.advfn.com/boards/read_msg.aspx?message_id=158231374
________________________________________________________________

________________________________________________________________

Buy, ONLY when the stocks price,
is trading under the Blue 8-day M.A.
when the Blue 8-day M.A. is under the Red 34-day M.A.
________________________________________________________________

Buy, ONLY when the stocks price,
is trading under the Blue 8-day M.A.
when the Blue 8-day M.A. is under the Red 34-day M.A.
________________________________________________________________

Buy, ONLY when the stocks price,
is trading under the Blue 8-day M.A.
when the Blue 8-day M.A. is under the Red 34-day M.A.
_______________________________________________________________

Buy, ONLY when the stocks price,
is trading under the Blue 8-day M.A.
when the Blue 8-day M.A. is under the Red 34-day M.A.
_______________________________________________________________

Buy, ONLY when the stocks price,
is trading under the Blue 8-day M.A.
when the Blue 8-day M.A. is under the Red 34-day M.A.
_______________________________________________________________

Buy, ONLY when the stocks price,
is trading under the Blue 8-day M.A.
when the Blue 8-day M.A. is under the Red 34-day M.A.
_______________________________________________________________

Buy, ONLY when the stocks price,
is trading under the Blue 8-day M.A.
when the Blue 8-day M.A. is under the Red 34-day M.A.
_______________________________________________________________

Buy, ONLY when the stocks price,
is trading under the Blue 8-day M.A.
when the Blue 8-day M.A. is under the Red 34-day M.A.
________________________________________________________________

Live! Charts
________________________________________________________________

________________________________________________________________

Live! Charts
________________________________________________________________

________________________________________________________________

Live! Charts
________________________________________________________________

________________________________________________________________

Live! Charts
________________________________________________________________

________________________________________________________________

Live! Charts
________________________________________________________________

________________________________________________________________

Live! Charts
________________________________________________________________

________________________________________________________________

Live! Charts
________________________________________________________________

________________________________________________________________

Live! Charts
________________________________________________________________

________________________________________________________________

Live! Charts
________________________________________________________________

________________________________________________________________

Live! Charts
________________________________________________________________

________________________________________________________________

Live! Charts
________________________________________________________________

________________________________________________________________

Live! Charts
________________________________________________________________

________________________________________________________________

Live! Charts
________________________________________________________________

________________________________________________________________

Live! Charts
________________________________________________________________

________________________________________________________________

Live! Charts
________________________________________________________________

________________________________________________________________

Live! Charts
________________________________________________________________

________________________________________________________________

Live! Charts
________________________________________________________________

________________________________________________________________

Live! Charts
________________________________________________________________

________________________________________________________________

Live! Charts
________________________________________________________________

________________________________________________________________

Live! Charts
________________________________________________________________

________________________________________________________________

Live! Charts
________________________________________________________________

________________________________________________________________

Live! Charts
________________________________________________________________

________________________________________________________________

Live! Charts
________________________________________________________________

________________________________________________________________

Live! Charts
________________________________________________________________

________________________________________________________________

Live! Charts
________________________________________________________________

________________________________________________________________

Live! Charts
________________________________________________________________

________________________________________________________________

Live! Charts
________________________________________________________________

________________________________________________________________

Live! Charts
________________________________________________________________

________________________________________________________________

Live! Charts

Recent DPLS News
- Form 8-K - Current report • Edgar (US Regulatory) • 05/29/2024 02:36:39 PM
- Form 8-K/A - Current report: [Amend] • Edgar (US Regulatory) • 05/24/2024 09:15:16 PM
- Form S-1/A - General form for registration of securities under the Securities Act of 1933: [Amend] • Edgar (US Regulatory) • 02/09/2024 03:56:55 PM
- Form 8-K - Current report • Edgar (US Regulatory) • 02/05/2024 09:25:34 PM
- Form 8-K - Current report • Edgar (US Regulatory) • 01/03/2024 07:14:41 PM
- Form S-1 - General form for registration of securities under the Securities Act of 1933 • Edgar (US Regulatory) • 12/18/2023 09:39:17 PM
- Form 8-K - Current report • Edgar (US Regulatory) • 12/13/2023 08:18:57 PM
- Form 8-K - Current report • Edgar (US Regulatory) • 12/05/2023 05:00:09 PM
- Form 10-Q - Quarterly report [Sections 13 or 15(d)] • Edgar (US Regulatory) • 11/15/2023 10:16:05 PM
- Form NT 10-Q - Notification of inability to timely file Form 10-Q or 10-QSB • Edgar (US Regulatory) • 11/14/2023 05:55:23 PM
- Form EFFECT - Notice of Effectiveness • Edgar (US Regulatory) • 11/14/2023 05:15:11 AM
- Form POS AM - Post-Effective amendments for registration statement • Edgar (US Regulatory) • 11/07/2023 09:29:36 PM
- Form POS AM - Post-Effective amendments for registration statement • Edgar (US Regulatory) • 10/20/2023 09:17:04 PM
- Form 8-K - Current report • Edgar (US Regulatory) • 10/10/2023 12:04:50 PM
- Form 8-K - Current report • Edgar (US Regulatory) • 10/03/2023 07:51:11 PM
- Form 10-Q - Quarterly report [Sections 13 or 15(d)] • Edgar (US Regulatory) • 09/22/2023 08:41:26 PM
- Form 10-Q/A - Quarterly report [Sections 13 or 15(d)]: [Amend] • Edgar (US Regulatory) • 08/31/2023 09:19:17 PM
- Form NT 10-Q - Notification of inability to timely file Form 10-Q or 10-QSB • Edgar (US Regulatory) • 08/14/2023 08:32:12 PM
- Form 8-K - Current report • Edgar (US Regulatory) • 08/14/2023 05:01:15 PM
- Form 8-K - Current report • Edgar (US Regulatory) • 08/03/2023 08:10:13 PM
- Form 8-K - Current report • Edgar (US Regulatory) • 08/01/2023 06:32:59 PM
- Form 10-Q - Quarterly report [Sections 13 or 15(d)] • Edgar (US Regulatory) • 07/18/2023 09:16:18 PM
- Form 8-K - Current report • Edgar (US Regulatory) • 07/10/2023 08:05:24 PM
Glidelogic Corp. Becomes TikTok Shop Partner, Opening a New Chapter in E-commerce Services • GDLG • Jul 5, 2024 7:09 AM
Freedom Holdings Corporate Update; Announces Management Has Signed Letter of Intent • FHLD • Jul 3, 2024 9:00 AM
EWRC's 21 Moves Gaming Studios Moves to SONY Pictures Studios and Green Lights Development of a Third Upcoming Game • EWRC • Jul 2, 2024 8:00 AM
BNCM and DELEX Healthcare Group Announce Strategic Merger to Drive Expansion and Growth • BNCM • Jul 2, 2024 7:19 AM
NUBURU Announces Upcoming TV Interview Featuring CEO Brian Knaley on Fox Business, Bloomberg TV, and Newsmax TV as Sponsored Programming • BURU • Jul 1, 2024 1:57 PM
Mass Megawatts Announces $220,500 Debt Cancellation Agreement to Improve Financing and Sales of a New Product to be Announced on July 11 • MMMW • Jun 28, 2024 7:30 AM


