


| Followers | 686 |
| Posts | 142976 |
| Boards Moderated | 35 |
| Alias Born | 03/10/2004 |
Tuesday, August 17, 2021 9:13:13 AM
By: Erin Swenlin | August 16, 2021
Today on the DecisionPoint Show Carl brought up the chart on Apple (AAPL) to discuss a recent comment from Jonathan Hoenig of the Capitalist Pig Hedge Fund on Fox Business news last week. At the time, he went out on a limb and said that he was shorting Apple. We admire his courage to take this contrarian position given most consider Apple to be teflon. We admittedly have the benefit of hindsight, but was Apple really that bearish?
Possibly, but the technicals appeared fairly healthy. Price was forming a symmetrical triangle which formed the "flag" on the end of a flagpole. A symmetrical triangle is a continuation pattern which in and of itself is bullish. Put that triangle on a flagpole and it becomes more bullish.
We are getting confirmation of today's price breakout given the PMO has turned back up and the RSI is positive. The OBV is hit and miss. We are seeing good volume coming in on today's breakout, but notice that the OBV is barely challenging its previous tops and is well-below the January top while price is not. That is a clear negative divergence. However, there are bullish relative strength lines at the bottom of the chart that show Apple had been underperforming, but it is now breaking that declining trend.
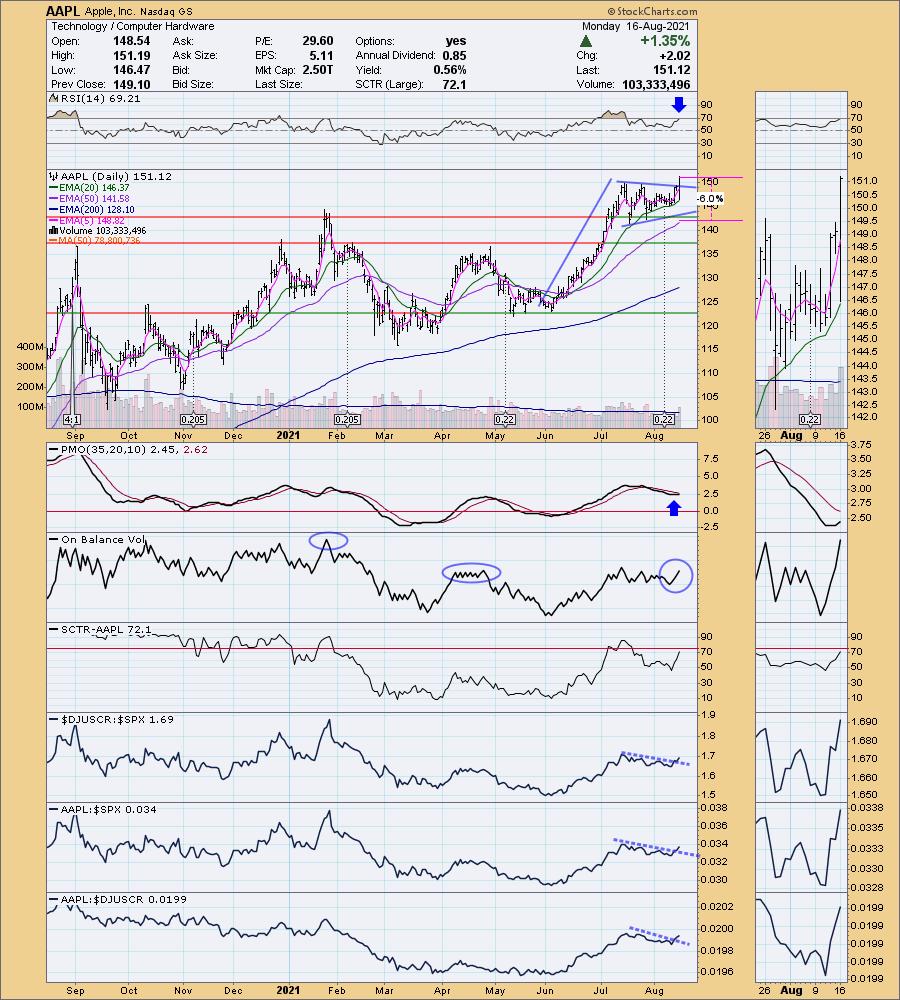
The weekly chart is mostly favorable. The weekly PMO is on a crossover BUY signal that occurred in oversold territory. The weekly OBV doesn't have a negative divergence, in fact the rising bottoms are confirming the rally. Problems? The RSI is overbought, but as we can see it has been more overbought. The price pattern isn't good as it shows an intermediate-term bearish rising wedge.

Conclusion: Apple is in a bullish configuration and should see more upside given the execution of the bull flag with today's breakout. The weekly chart confirms positive momentum and volume. Just be careful if it gets too overbought.
Technical Analysis is a windsock, not a crystal ball.
--Erin Swenlin
Read Full Story »»»
 DiscoverGold
Information posted to this board is not meant to suggest any specific action, but to point out the technical signs that can help our readers make their own specific decisions. Caveat emptor!
• DiscoverGold
Recent AAPL News
- Alphabet Unveils AlphaProof and AlphaGeometry 2; OpenAI Tests SearchGPT; Apple Loses Market Share in China • IH Market News • 07/26/2024 10:07:41 AM
- Meta Unveils Llama 3 AI Model, Elon Musk’s X Poll Backs Tesla’s $5B xAI Investment, and More • IH Market News • 07/24/2024 09:53:32 AM
- Johnson Controls Division Sold for $8 Billion; Alphabet’s Offer Rejected by Wiz; AMD President Announces Retirement • IH Market News • 07/23/2024 10:00:52 AM
- Microsoft Shares Drop 2% and CrowdStrike Plunges 21% Pre-Market Following Major Global Outage • IH Market News • 07/19/2024 10:01:22 AM
- Darden Acquires Chuy’s for $605M, BYND Drops 14% Amid Debt Restructuring, Petco Appoints Ex-Five Below CEO • IH Market News • 07/18/2024 09:59:44 AM
- Apple scores record 72 Emmy Award nominations & sweeps across top categories including Outstanding Limited series for “Lessons in Chemistry,” Outstanding Drama for “The Morning Show” & “Slow Horses” & Outstanding Comedy for “Palm Royale” • Business Wire • 07/17/2024 10:05:00 PM
- Match Group Soars 8% Amid Potential Sale Pressure; Deutsche Bank Anticipates 2Q Loss, and More • IH Market News • 07/16/2024 10:10:09 AM
- Alphabet Nears $23 Billion Wiz Acquisition, Trump Media Stock Soars 63% Pre-Market, and More • IH Market News • 07/15/2024 10:34:36 AM
- Ericsson Reports 14% Profit Increase, UBS Downgrades Tesla Shares, Ozempic Linked to Reduced Dementia Risk • IH Market News • 07/12/2024 10:28:11 AM
- Tamer-Than-Expected Inflation Data May Lead To Extended Rally On Wall Street • IH Market News • 07/11/2024 01:09:48 PM
- Costco Hikes Membership Fees; ON Semiconductor Stock Drops 3%; WD-40 Soars 13% on Strong Q3 Earnings • IH Market News • 07/11/2024 10:17:26 AM
- U.S. Stocks Rally Ahead Of Close Watched Inflation Data • IH Market News • 07/10/2024 08:44:00 PM
- NEAR Achieves New Milestones, TIA Faces Market Volatility, Block Unveils Advanced Mining Chips • IH Market News • 07/10/2024 07:47:39 PM
- Tech Stocks May Lead Initial Upward Move On Wall Street • IH Market News • 07/10/2024 01:11:51 PM
- Microsoft and Apple Exit OpenAI Board, TSMC Exceeds Forecasts with Record Revenue, and Other Key Updates • IH Market News • 07/10/2024 10:42:17 AM
- Paramount-Skydance $28B Merger, Boeing Agrees to Plead Guilty with $243.6M Fine, and More News • IH Market News • 07/08/2024 10:37:52 AM
- Apple Joins OpenAI Board, Logitech President Opts Out of Reelection, and More News • IH Market News • 07/03/2024 10:59:39 AM
- U.S. Stocks Close Higher; Nasdaq Outperforms • IH Market News • 07/01/2024 09:10:17 PM
- Dow Dips, Nasdaq Gains, Oil Prices Rise • IH Market News • 06/26/2024 11:00:03 AM
- SolarEdge Stock Falls 13%, Wegovy Approved in China, Grail Nasdaq Debut, Apple Rejects Meta Chatbot • IH Market News • 06/25/2024 10:36:11 AM
- UPS Divests Coyote Logistics in $1.025 Billion Deal with RXO, Under Armour Agrees to $434 million Settlement, and More News • IH Market News • 06/24/2024 11:00:20 AM
- Trump Media Resells Stocks and Warrants; KB Home Exceeds Q2 Expectations, and More News • IH Market News • 06/20/2024 10:55:11 AM
- Apple The Exchange TRX to welcome its first customers this Saturday, June 22, in Kuala Lumpur • Business Wire • 06/20/2024 02:00:00 AM
- Nvidia Overtakes Microsoft To Become World’s Most Valuable Company • IH Market News • 06/19/2024 09:32:08 AM
- Fisker Files for Bankruptcy, Chegg Stocks Rise on 23% Workforce Reduction, and More • IH Market News • 06/18/2024 11:02:13 AM
Glidelogic Corp. Announces Revolutionary AI-Generated Content Copyright Protection Solution • GDLG • Jul 26, 2024 12:30 PM
Southern Silver Files NI43-101 Technical Report for its Updated Preliminary Economic Assessment for the Cerro Las Minitas Project • SSV • Jul 25, 2024 8:00 AM
Greenlite Ventures Completes Agreement with No Limit Technology • GRNL • Jul 19, 2024 10:00 AM
VAYK Expects Revenue from First Airbnb Property Starting from August • VAYK • Jul 18, 2024 9:00 AM
North Bay Resources Acquires Mt. Vernon Gold Mine, Sierra County, California, with Assays up to 4.8 oz. Au per Ton • NBRI • Jul 18, 2024 9:00 AM
Nightfood Holdings Signs Letter of Intent for All-Stock Acquisition of CarryOutSupplies.com • NGTF • Jul 17, 2024 1:00 PM

