


| Followers | 689 |
| Posts | 143817 |
| Boards Moderated | 35 |
| Alias Born | 03/10/2004 |
Friday, June 18, 2021 9:55:45 AM
By: Fawad Razaqzada | June 18, 2021
Crude oil was struggling to find support on Friday after a two-day sell-off. As the rally fizzled out, the key question is whether oil prices are now on a slippery slope, or whether this is just a pause in the uptrend? Whatever the case, expect to see at least a bit more selling, judging by the drops in other commodities and this week’s bearish-looking price action in oil.
Oil prices have been driven sharply higher from their historic drop last year, due to supply restrictions from the OPEC+ group and optimism about recovering demand as coronavirus lockdowns and other restrictions ease. The dollar’s bearish trend had also supported buck-denominated oil prices.
But just like gold and copper, crude oil is not immune to a rebounding dollar, with the greenback storming back to life in response to a hawkish Federal Reserve policy decision last week. The fact that several other commodities have also weakened means sentiment towards the sector has turned negative, hurting crude oil in the process.
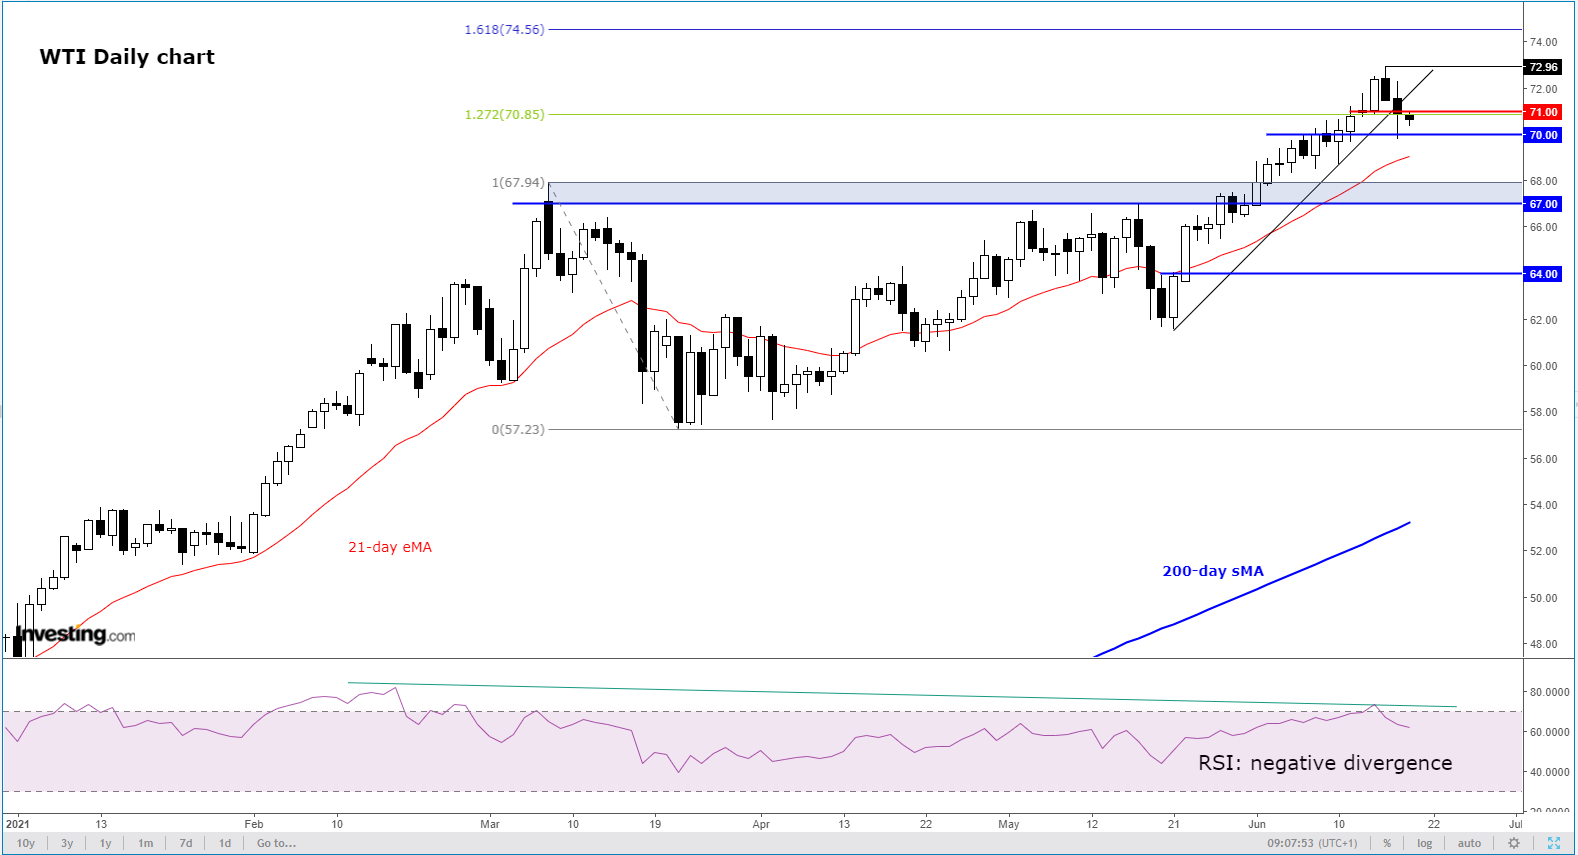
Oil Daily
The daily oil chart shows a three-bar reversal pattern and a trend break. The base of this reversal is around $71.00, a level which was being tested from underneath at the time of writing. It is likely that this level will offer resistance having previously served as support, potentially leading to another drop. The next area of potential support is the shaded region around $67.00 - $68.00.
Zooming out to the weekly chart and we can see further bearish price action:
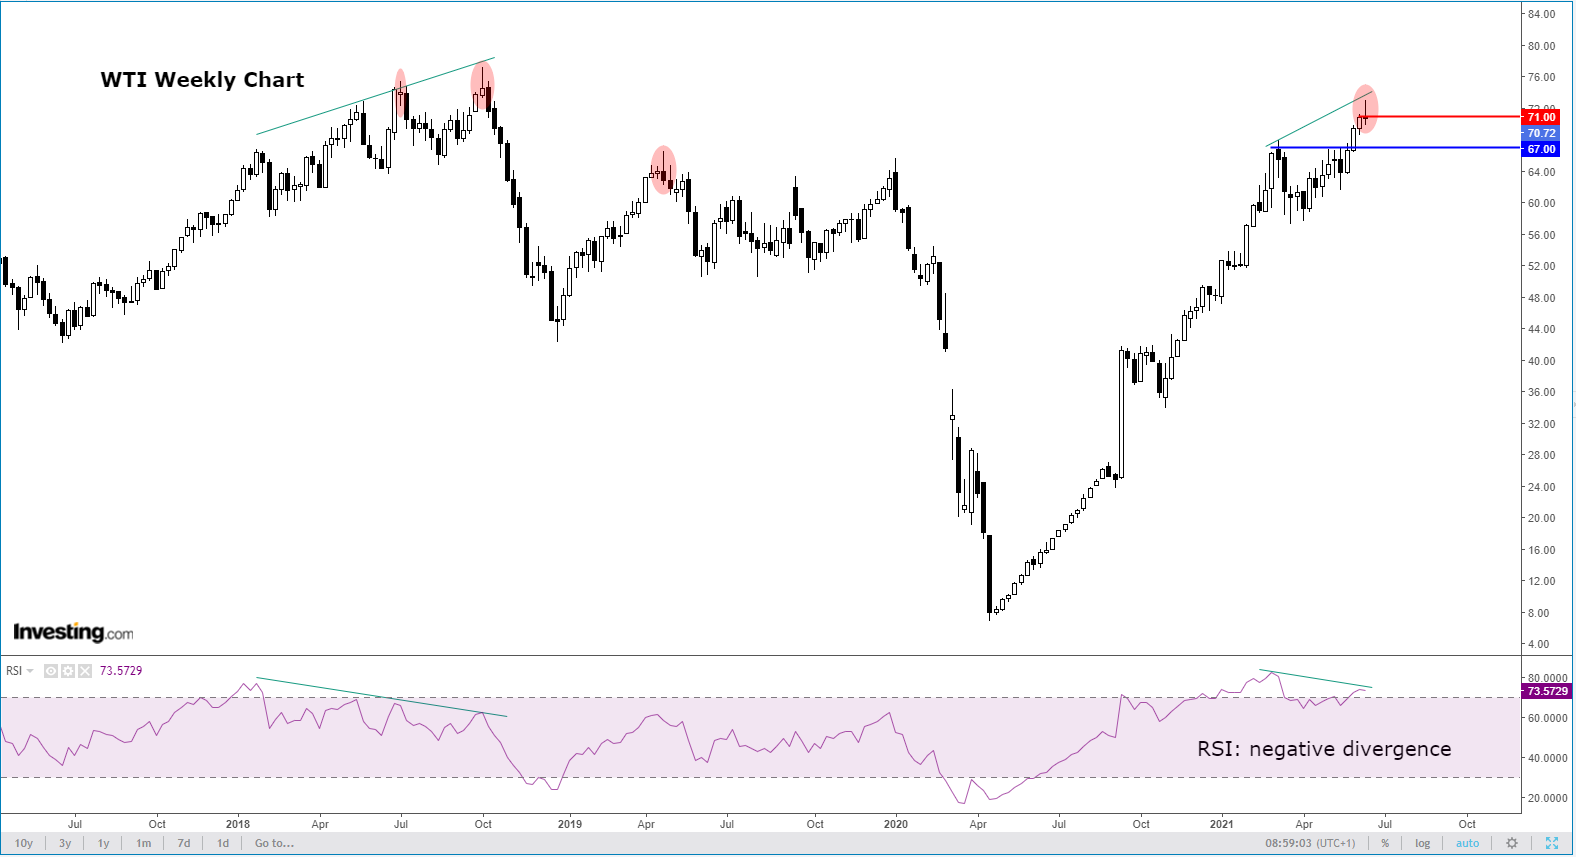
Oil Weekly
On this time frame, WTI is currently displaying an incomplete doji candle, which, by the close of the week, could look like a hammer or a bearish engulfing candle if the selling continues today. Interestingly, the Relative Strength Index (RSI) is in a state of negative divergence, making lower highs compared with the higher highs in the underlying oil price. This points to a weakening bull trend. Previously such divergences had caused big drops in oil.
Oil’s drop, if sustained, could have ramifications elsewhere. For example, the S&P energy sector (XLE), which has been this year's best performer, could weigh on the benchmark stock index. The likes of the Canadian dollar and Norwegian krone could also suffer.
Read Full Story »»»
 DiscoverGold
Information posted to this board is not meant to suggest any specific action, but to point out the technical signs that can help our readers make their own specific decisions. Caveat emptor!
• DiscoverGold
VHAI - Vocodia Partners with Leading Political Super PACs to Revolutionize Fundraising Efforts • VHAI • Sep 19, 2024 11:48 AM
Dear Cashmere Group Holding Co. AKA Swifty Global Signs Binding Letter of Intent to be Acquired by Signing Day Sports • DRCR • Sep 19, 2024 10:26 AM
HealthLynked Launches Virtual Urgent Care Through Partnership with Lyric Health. • HLYK • Sep 19, 2024 8:00 AM
Element79 Gold Corp. Appoints Kevin Arias as Advisor to the Board of Directors, Strengthening Strategic Leadership • ELMGF • Sep 18, 2024 10:29 AM
Mawson Finland Limited Further Expands the Known Mineralized Zones at Rajapalot: Palokas step-out drills 7 metres @ 9.1 g/t gold & 706 ppm cobalt • MFL • Sep 17, 2024 9:02 AM
PickleJar Announces Integration With OptCulture to Deliver Holistic Fan Experiences at Venue Point of Sale • PKLE • Sep 17, 2024 8:00 AM

