


| Followers | 692 |
| Posts | 147239 |
| Boards Moderated | 34 |
| Alias Born | 03/10/2004 |
Friday, June 11, 2021 4:03:53 PM
By: Dr. Arnout ter Schure | June 11, 2021
It has been a month since I last provided an update on Apple shares (NASDAQ:AAPL). Back then, it was trading at around $122-123. Now, it’s trading at $127, a 4% gain in a month. That is not much to write home about, nor much that helps me constructively assess the next most likely move. Besides, while the NASDAQ Composite and the Nasdaq 100 are close to their all-time highs, albeit having been range-bound since February this year, Apple is still down 11.8% from its January all-time high. It is underperforming these two major indexes. Not to mention in comparison to the S&P 500 and Dow Jones Industrial Average, which have set fresh all-time highs almost daily. Thus, all Apple has done so far is hold its 200-day Simple Moving Average (SMA) on three occasions. See Figure 1 below.
As long as it can do that, the bulls have a shot at keeping prices elevated.
Figure 1. AAPL Daily candlestick chart with technical indicators and preferred Elliott Wave count
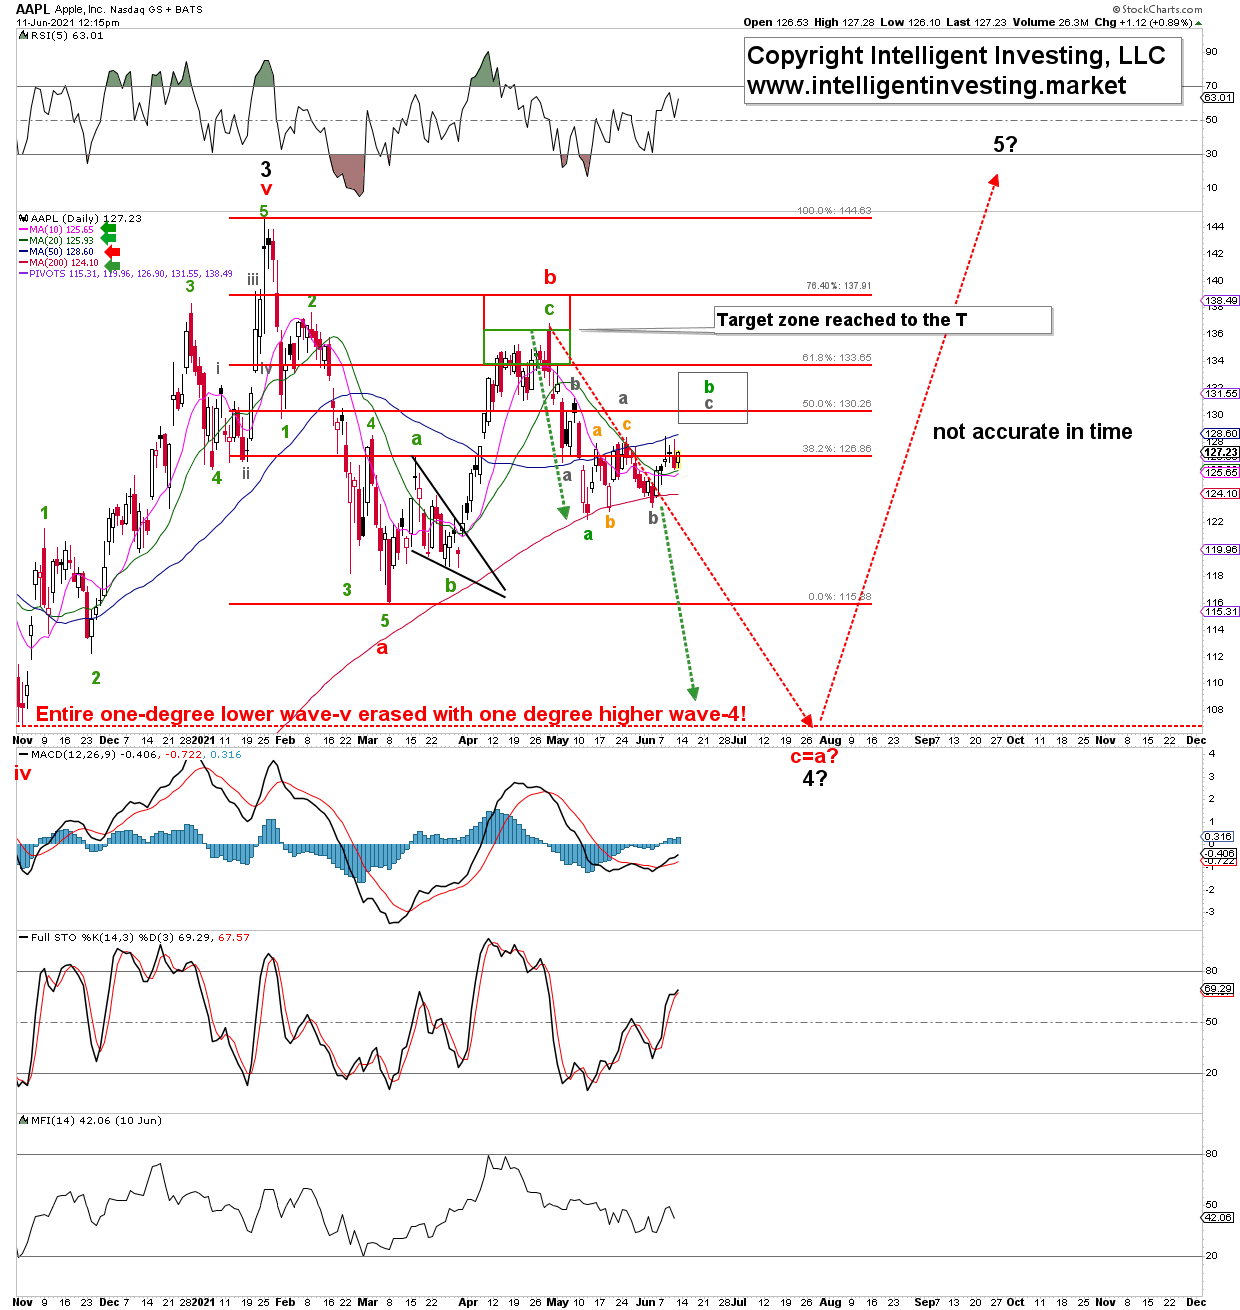
Apple Daily Candlestick Chart With Elliott Wave Count.
However, Apple is still below its 50-day SMA. As long as it is, the pressure remains down over the intermediate term. The price action since my last update has been somewhat overlapping and, thus, according to the Elliott Wave Principle (EWP), it is most likely corrective. I expect it – at best – to top out in the grey target zone of $132+/-2 before heading lower to the $105-110 area to complete wave-c of c of 4.
Buyers have stepped in three times at the 200-day SMA, and it is logical to assume that a fourth time there will not be any charm, and sellers will likely take over. The green dotted arrows show symmetry breakdown targets in the ideal (black) major wave-4 target zone.
Bottom line: Apple is underperforming the essential major U.S. indexes. That by itself is a sign of weakness. It has only gained 4% over a month, is barely holding on to its 200-day SMA, while having lost its 50-day SMA as support. The price action during the past month has been erratic and, per the EWP, it is, therefore, most likely corrective – i.e., when complete, expect Apple’s share price to move down again. Whereas a rally to around $132+/-2 first cannot be excluded, a loss of the 200-day SMA will then swiftly target the ideal $105-110 target zone, from where I still expect the next multi-month rally to start.
Read Full Story »»»
 DiscoverGold
Information posted to this board is not meant to suggest any specific action, but to point out the technical signs that can help our readers make their own specific decisions. Caveat emptor!
• DiscoverGold
Recent AAPL News
- Form PX14A6G - Notice of exempt solicitation submitted by non-management • Edgar (US Regulatory) • 02/13/2025 06:50:03 PM
- Form 4 - Statement of changes in beneficial ownership of securities • Edgar (US Regulatory) • 02/04/2025 11:35:59 PM
- Form 4 - Statement of changes in beneficial ownership of securities • Edgar (US Regulatory) • 02/04/2025 11:35:07 PM
- Form 4 - Statement of changes in beneficial ownership of securities • Edgar (US Regulatory) • 02/04/2025 11:34:04 PM
- Form 4 - Statement of changes in beneficial ownership of securities • Edgar (US Regulatory) • 02/04/2025 11:32:42 PM
- Form 4 - Statement of changes in beneficial ownership of securities • Edgar (US Regulatory) • 02/04/2025 11:31:18 PM
- Introducing Apple Invites, a new app that brings people together for life’s special moments • Business Wire • 02/04/2025 04:00:00 PM
- Form 144 - Report of proposed sale of securities • Edgar (US Regulatory) • 02/03/2025 09:18:58 PM
- Trade War Concerns May Spark Early Sell-Off On Wall Street • IH Market News • 02/03/2025 02:01:29 PM
- White House Confirmation Tariffs Will Take Effect Leads To Downturn On Wall Street • IH Market News • 01/31/2025 09:52:30 PM
- Futures Pointing To Higher Open On Upbeat Apple Earnings, Inflation Data • IH Market News • 01/31/2025 02:07:08 PM
- Form 10-Q - Quarterly report [Sections 13 or 15(d)] • Edgar (US Regulatory) • 01/31/2025 11:01:27 AM
- Form 8-K - Current report • Edgar (US Regulatory) • 01/30/2025 09:30:23 PM
- Apple reports first quarter results • Business Wire • 01/30/2025 09:30:00 PM
- Form PX14A6G - Notice of exempt solicitation submitted by non-management • Edgar (US Regulatory) • 01/29/2025 05:24:33 PM
- Apple Miami Worldcenter opens Friday, January 24, in downtown Miami • Business Wire • 01/22/2025 02:00:00 PM
- U.S. Stocks May See Initial Strength As Treasury Yields Extend Pullback • IH Market News • 01/17/2025 02:02:01 PM
- Apple MixC Hefei opens for customers this Saturday, January 18, in Anhui, China • Business Wire • 01/16/2025 05:00:00 AM
- Form 3 - Initial statement of beneficial ownership of securities • Edgar (US Regulatory) • 01/10/2025 11:30:12 PM
- Form DEFA14A - Additional definitive proxy soliciting materials and Rule 14(a)(12) material • Edgar (US Regulatory) • 01/10/2025 09:37:12 PM
- Form DEF 14A - Other definitive proxy statements • Edgar (US Regulatory) • 01/10/2025 09:31:18 PM
- U.S. Stocks May Move To The Upside In Early Trading • IH Market News • 01/03/2025 02:06:00 PM
- U.S. Stocks Finish Volatile Session Modestly Lower • IH Market News • 01/02/2025 09:46:55 PM
- U.S. Stocks May See Further Downside After • IH Market News • 12/30/2024 02:12:52 PM
- U.S. Stocks May See Further Downside After Friday’s Sell-Off • IH Market News • 12/30/2024 02:12:52 PM
YCRM ReachOut Technology Returns to Trading: CEO Rick Jordan Lays Out Blockchain CyberSecurity Strategy and Industry-First AI MSP Partnership In Shareholder Letter • YCRM • Feb 18, 2025 11:20 AM
VAYK Confirms No Dilution Following Recent Acquisition and 11 Million Insider Purchase • VAYK • Feb 18, 2025 9:30 AM
UAV Corp. (OTC: UMAV) Announces Nationwide Teleconference to Provide Shareholders with Key Updates on Contracts, Future Plans, and Share Structure • UMAV • Feb 18, 2025 8:30 AM
COEPTIS Announces the Launch of COEP Venture Group to Invest in AI, RPA, and AI Agent Startups • COEP • Feb 13, 2025 9:10 AM
Unitronix Corp. to Report Over 300% Gains in Cryptocurrency Assets • UTRX • Feb 13, 2025 7:15 AM
Hivello Token ($HVLO) now Live • MATE • Feb 11, 2025 9:27 AM


