This Measure Suggests the IPO Bubble Has Popped By: SentimenTrader | May 10, 2021
After a multi-month bounce and consolidation phase, the Renaissance IPO Index formed a significant intermediate-term top last week. IPOs represent one of the more speculative areas of the market, especially in the last few decades as the percentage of unprofitable companies coming public has surged.
One has to wonder what, if any, message can we gain from the balloon popping. Are the speculative pockets of the market like IPOs starting to discount peak liquidity as the fiscal and monetary accommodation can't last forever?
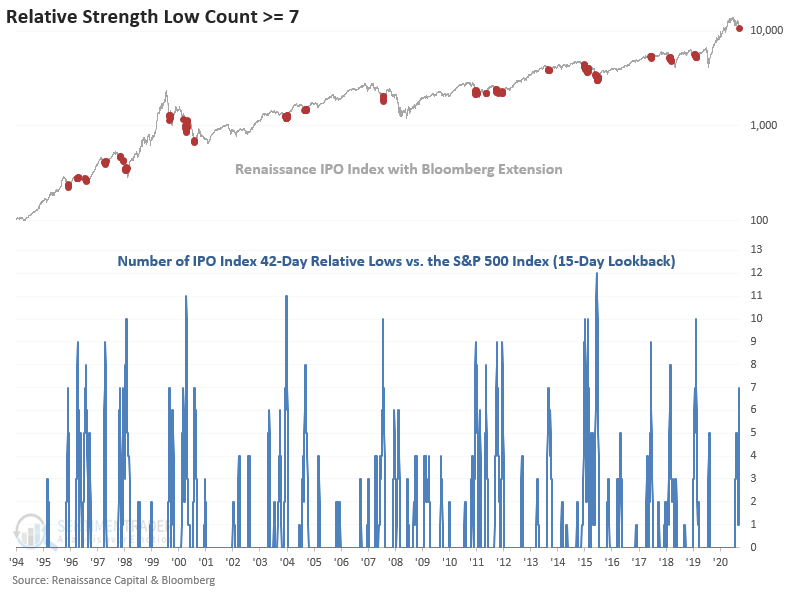
When Dean applied a relative strength indicator to the IPO/S&P 500 ratio to assess relative performance, the weakness in IPOs really stands out. The indicator in the chart below counts the number of IPO Index 42-day relative lows versus the S&P 500 index in the last 15 days. A high count reflects severe underperformance.
The count reached 7 late last week.
When the relative low count reaches 7 after the IPO Index registered a 252-day high, forward performance in the IPO Index is weak in the 2-4 week timeframe with z-scores that suggest significance.
Information posted to this board is not meant to suggest any specific action, but to point out the technical signs that can help our readers make their own specific decisions. Caveat emptor! • DiscoverGold
Register for free to join our community of investors and share your ideas. You will also get access to streaming quotes, interactive charts, trades, portfolio, live options flow and more tools.


 News
News  Market Data
  Discover