SPX Monitoring Purposes: Sold long 4/9/21 SPX at 4128.80= gain 6.16%; Long SPX on 3/24/21 at 3889.14
Monitoring Purposes GOLD: Long GDX on 10/9/20 at 40.78
Long Term SPX Monitor Purposes: Sold long SPX on 1/15/21 at 3768.25= gain 10.80%; Long SPX on 10/26/20 at 3400.97
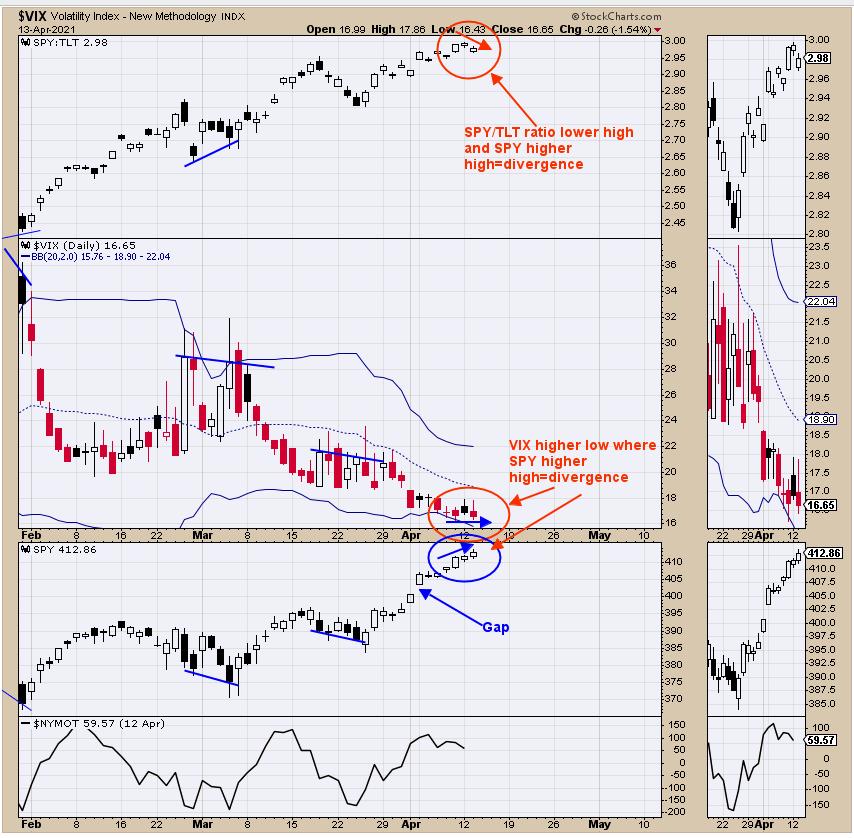
Short-term divergences are present in the market. The top window is the SPY/TLT ratio, which follows the SPY and helps to confirm the up and down movement. When the SPY makes a higher high and the SPY/TLT makes a lower high, there is a divergence, and this is what is happening now. The middle window is the VIX, which moves the opposite of the SPY. Today, the SPY touched a new high and the VIX made a higher low, which is another divergence. Not expecting a large pull back here, but a timeout to the uptrend is likely in the coming days. There is a gap near the 400 SPY level and is our worst case scenario for a potential pull back. Staying neutral for now.
The market is in good shape. The top window is the NYSE McClellan Summation index. The market is considered to be in an uptrend when this index is above "0" and a strong uptrend when it stays above +600 (current reading is +650.81). There can be short term pull backs when the Summation index is above 0, but a 10% or larger pull back is unlikely. Things can get ugly when the NYSE McClellan Summation index falls below 0, which is identified with blue vertical lines on the chart above.
Above is the monthly XAU/Gold ratio going back to 1999 (middle window). The monthly GDX/GLD ratio is setting at an important level up against a trend line, which is the 2016 and 2014 highs and the 2009 low along with the downtrend line going back to 1996. These trend lines converge near .085 on XAU/Gold ratio (yesterday's close was .083). The top window is the monthly RSI for the XAU/Gold ratio, which as been rising the last few months showing the ratio has been rising. This ratio has been "hugging" the red vertical line since last August and not backing away, suggesting at some point this ratio will power though this line. The rally through both of these trend lines most likely will be strong, as that is usually what happens when resistance is broken. A jump in the XAU/Gold ratio will produce a strong rise in gold stocks. Don't know when this jump will occur, as this chart is on the monthly time frame but would appear it could be within the next several weeks, if not sooner. The wait should be worth it. Long GDX (10/9/20 at 40.78).
Information posted to this board is not meant to suggest any specific action, but to point out the technical signs that can help our readers make their own specific decisions. Caveat emptor! • DiscoverGold
Register for free to join our community of investors and share your ideas. You will also get access to streaming quotes, interactive charts, trades, portfolio, live options flow and more tools.


 News
News  Market Data
  Discover