The Semiconductors (SMH) Snap Back By: Bespoke Investment Group | April 5, 2021
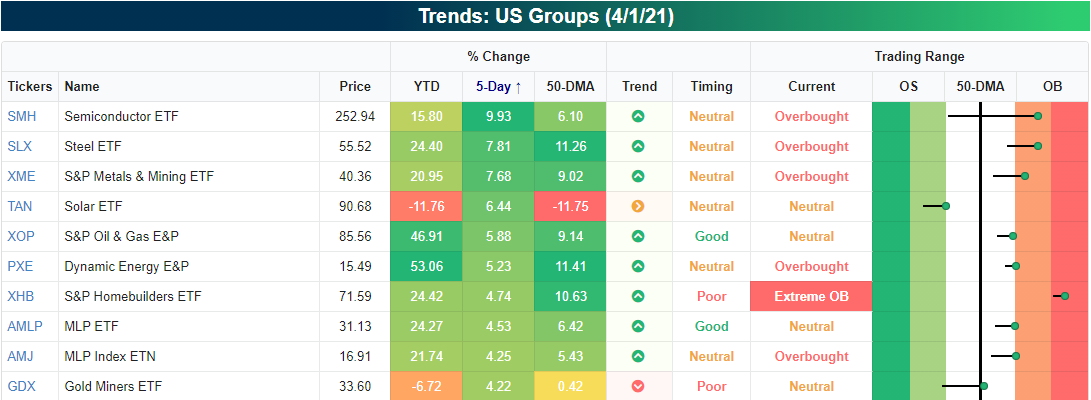
Headed into the long weekend, the Semiconductors (SMH) had been on a very impressive run over the prior five days. As shown in the snapshot of the US Groups screen in our Trend Analyzer, the group was the top performer (up just under 10%) in the five days ending last Thursday. That move brought it from well below its 50-DMA to deep into overbought territory.
While the Semiconductor ETF (SMH) is up again today, it is still over 1% below its highs from mid-February. Meanwhile, the Philadelphia Semiconductor Index (SOX) has already broken out to a new record intraday high this morning.
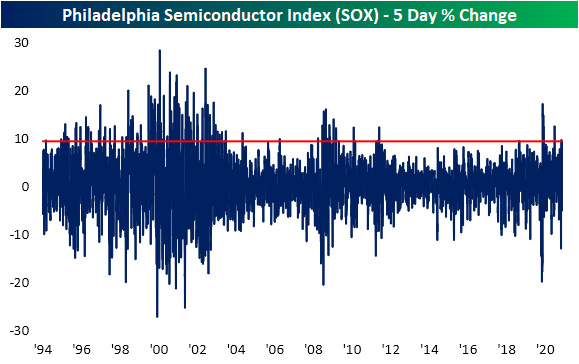
Today's gain for the SOX adds to a 9.5% gain for the index last week. As shown in the chart below, that 9.5% rally is historically large, especially relative to the past several years. In fact, the five-day gain through Thursday's close stands in the top 5% of all five-day runs for the index. While there was another occurrence as recently as the five days ending March 15th, moves of this size have been fairly uncommon in the past decade. Prior to the most recent and March occurrences, the only other recent instances were in November and the spring of last year. Prior to 2020, the past decade only saw a small handful of other instances of rallies in the 95th percentile or better. Conversely, the volatility of the Financial Crisis and the late 1990s and early 2000s led to more frequent clusters of top 5% moves.
In the charts below, we show the performance of the semiconductor index following rallies that rank in the top 5% of all 5-day changes without another occurrence in the prior two weeks. The results show that there's typically a near-term cool-down period after such a sharp one-week rally. One and two weeks later have both tended to underperform the norm (by 42 bps and 90 bps respectively), averaging declines with positive returns less than half the time. While there has been some near-term weakness, one month and a quarter out have both tended towards outperformance.
Information posted to this board is not meant to suggest any specific action, but to point out the technical signs that can help our readers make their own specific decisions. Caveat emptor! • DiscoverGold
Register for free to join our community of investors and share your ideas. You will also get access to streaming quotes, interactive charts, trades, portfolio, live options flow and more tools.


 News
News  Market Data
  Discover