


| Followers | 689 |
| Posts | 143817 |
| Boards Moderated | 35 |
| Alias Born | 03/10/2004 |
Monday, March 22, 2021 9:12:13 AM
Wall Street's "Fear Gauge" Could See More March Madness
By: Schaeffer's Investment Research | March 22, 2021
• Keep an eye on the NDX's 40-day moving average
• Expiration week saw VIX put open interest decline
Despite Fed Chairman Jerome Powell receiving accolades for his presser on Wednesday afternoon, by Thursday’s session market participants had changed their minds. In other words, buyers surfaced noticeably on Wednesday afternoon, on the heels of the Fed holding steady on rates, and releasing an updated dot-plot forecast that included a significant upward revision to its 2021 gross domestic product (GDP) forecast. In fact, Powell repeated he expects the Fed to hold interest rates where they are into 2023, even after being asked about the potential inflationary impacts of this expectation.
By Thursday morning, after taking time to digest the new forecasts and the implications of Powell’s message, bond yields again shot higher, pushing tech stocks lower at the start, and the rest of the market lower by close.
3/19 $SPY open interest . 397 & 400 strike calls were mostly bought (to open), so longer $SPY remains below these strikes, long positions associated with them will slowly be liquidated. Delta-hedge sell risk doesn't kick in until move down to vicinity of put-heavy 370 strike

In fact, the high of the week for the SPDR S&P 500 ETF Trust (SPY - 389.48) was $397.26, site of heavy call open interest in last week’s expiring series. After the SPY gaped lower on Thursday morning, and it was evident the 397-strike was not going to be retaken, the SPY declined into the close, perhaps due to an unwinding of long positions associated with the expiring 397- and 400-strike call open interest.
“…for the second time in as many weeks, the Thursday and Friday VIX peaks failed to take out its 252-day moving average, suggesting that as we enter this week's trading, the bulls remain in control. In fact, this long-term moving average (which equates to the VIX’s average for one year) has marked peaks in VIX spikes four of the last five times since mid-December.
For now, the script is that if you are using the VIX for clues on equity direction, be cautious when this volatility expectation measure retreats to the 20 area, as it did in early December and mid-February. Moreover, look to be buyers when the VIX rallies up to its 252-day moving average and shows evidence of retreating. But buyers beware -- if the VIX closes above the 252-day moving average again, prepare for more short-term equity damage.”
- Monday Morning Outlook, March 8, 2021
After the Fed meeting and Powell’s press conference on Wednesday, the Cboe Market Volatility Index (VIX - 20.95), also known as Wall Street's "fear gauge," closed at its lowest level in more than a year. As I observed on Twitter, the reading was back to a level that has preceded equity weakness since the stock market hits its pandemic low in March 2020. At best, a period of short-term choppiness has followed, and at worst noticeable short-term pullbacks have ensued.
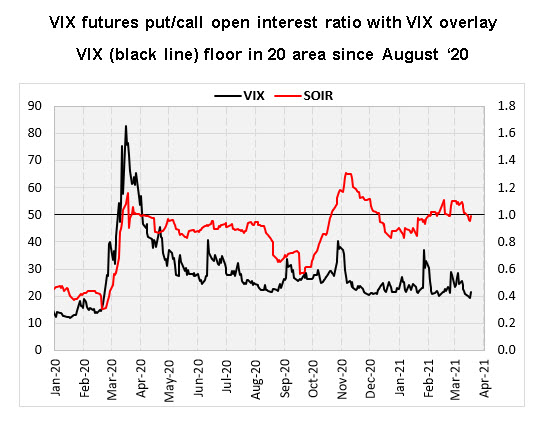
As I have noted in the past, the VIX is more prone to pops after VIX expirations, which was the case this past Wednesday. However, this was the case when call open interest was predominant, a scenario in place for years.
Note in the graph below that for VIX futures options expiring in April, May, and June, that beginning in late-February, put open interest exceeded call open interest. Such situations are rare. But historical occurrences in the past have preceded a declining VIX. This time around, VIX put open interest gained traction, versus call open interest, when the VIX was making its most recent peak around its 252-day moving average.
The current open interest configuration on VIX futures could be hinting that the VIX is poised to break below the 19-20 floor in the weeks or months ahead.
In the meantime, the S&P 500 Index (SPX - 3,913.10) continues to trade in a well-defined channel since mid-November, when headlines about Covid-19 vaccines turned decidedly positive, lending support that there was a light at the end of the tunnel for a return to normal.
In fact, the SPX tested the lower boundary of this channel in the selling that emerged late last week. If the SPX continues to trade in this channel, it would make sense that the VIX breaks below its multi-month long floor.
As we enter this week’s trading, the top of this channel resides in a range between 4,045 and 4,065, but resistance could also come into play at the round 4,000 millennium level and 4,056, which represents six times the 2009 closing low.
The lower boundary of this channel ranges between 3,910 today and 3,930 at week’s end. If the SPX breaks below this range, look for the 3,835 to 3,850 area to come into play, which is the site of an extended trendline drawn through lower highs in February. The closing level ahead of the breakout above this trendline two weeks ago was at 3,875 and, as such, adds another level of support before 3,835-3,850 comes into play. Coincidentally, the SPX’s 40-day moving average is sitting at 3,875.

In fact, after a spike in the equity-only, buy-to-open put/call volume ratio to multi-month highs, a subsequent decline in this ratio paves the way for the SPX to advance from the support last week, as increasing short-term trader skepticism peaked.
But the peak occurred at a relatively low level, suggesting the market may quickly become vulnerable after only a minimal advance.

After Thursday’s trading, my volume on CNBC was on, but my back was to the television. I heard many guests indicate the big-cap technology pullback was a buying opportunity. From that perspective only, I would advise being careful if treading into those waters.
However, the 10-day buy-to-open put/call volume ratio on Nasdaq-100 Index (NDX - 12,866.99) components only spiked to near its November high, and is now rolling over. Similar action in this ratio was a buying opportunity in November, so there is a sentiment-based bullish case.

If you are looking for technical permission to enter a bullish, large-cap technology trade, which is advised, I think it is best if you look for resistance that I discussed last week to get taken out. Specifically, and per the chart below, look for the NDX to climb back above a combination of its 40-day moving average, which marked last week’s peak. Plus, the 13,000 level and 13,037, which is a 50% Fibonacci retracement of the recent closing high and low, remain significant.
In the meantime, good luck on your brackets. While most of you will not leverage your investment in the tournament games, remember that options give you that year-round leverage you are seeking. And with the VIX recently coming off its lowest level in months, and earnings season passed, options are cheap.

Read Full Story »»»
 DiscoverGold
By: Schaeffer's Investment Research | March 22, 2021
• Keep an eye on the NDX's 40-day moving average
• Expiration week saw VIX put open interest decline
Despite Fed Chairman Jerome Powell receiving accolades for his presser on Wednesday afternoon, by Thursday’s session market participants had changed their minds. In other words, buyers surfaced noticeably on Wednesday afternoon, on the heels of the Fed holding steady on rates, and releasing an updated dot-plot forecast that included a significant upward revision to its 2021 gross domestic product (GDP) forecast. In fact, Powell repeated he expects the Fed to hold interest rates where they are into 2023, even after being asked about the potential inflationary impacts of this expectation.
By Thursday morning, after taking time to digest the new forecasts and the implications of Powell’s message, bond yields again shot higher, pushing tech stocks lower at the start, and the rest of the market lower by close.
3/19 $SPY open interest . 397 & 400 strike calls were mostly bought (to open), so longer $SPY remains below these strikes, long positions associated with them will slowly be liquidated. Delta-hedge sell risk doesn't kick in until move down to vicinity of put-heavy 370 strike

In fact, the high of the week for the SPDR S&P 500 ETF Trust (SPY - 389.48) was $397.26, site of heavy call open interest in last week’s expiring series. After the SPY gaped lower on Thursday morning, and it was evident the 397-strike was not going to be retaken, the SPY declined into the close, perhaps due to an unwinding of long positions associated with the expiring 397- and 400-strike call open interest.
“…for the second time in as many weeks, the Thursday and Friday VIX peaks failed to take out its 252-day moving average, suggesting that as we enter this week's trading, the bulls remain in control. In fact, this long-term moving average (which equates to the VIX’s average for one year) has marked peaks in VIX spikes four of the last five times since mid-December.
For now, the script is that if you are using the VIX for clues on equity direction, be cautious when this volatility expectation measure retreats to the 20 area, as it did in early December and mid-February. Moreover, look to be buyers when the VIX rallies up to its 252-day moving average and shows evidence of retreating. But buyers beware -- if the VIX closes above the 252-day moving average again, prepare for more short-term equity damage.”
- Monday Morning Outlook, March 8, 2021
After the Fed meeting and Powell’s press conference on Wednesday, the Cboe Market Volatility Index (VIX - 20.95), also known as Wall Street's "fear gauge," closed at its lowest level in more than a year. As I observed on Twitter, the reading was back to a level that has preceded equity weakness since the stock market hits its pandemic low in March 2020. At best, a period of short-term choppiness has followed, and at worst noticeable short-term pullbacks have ensued.
As I have noted in the past, the VIX is more prone to pops after VIX expirations, which was the case this past Wednesday. However, this was the case when call open interest was predominant, a scenario in place for years.
Note in the graph below that for VIX futures options expiring in April, May, and June, that beginning in late-February, put open interest exceeded call open interest. Such situations are rare. But historical occurrences in the past have preceded a declining VIX. This time around, VIX put open interest gained traction, versus call open interest, when the VIX was making its most recent peak around its 252-day moving average.
The current open interest configuration on VIX futures could be hinting that the VIX is poised to break below the 19-20 floor in the weeks or months ahead.

In the meantime, the S&P 500 Index (SPX - 3,913.10) continues to trade in a well-defined channel since mid-November, when headlines about Covid-19 vaccines turned decidedly positive, lending support that there was a light at the end of the tunnel for a return to normal.
In fact, the SPX tested the lower boundary of this channel in the selling that emerged late last week. If the SPX continues to trade in this channel, it would make sense that the VIX breaks below its multi-month long floor.
As we enter this week’s trading, the top of this channel resides in a range between 4,045 and 4,065, but resistance could also come into play at the round 4,000 millennium level and 4,056, which represents six times the 2009 closing low.
The lower boundary of this channel ranges between 3,910 today and 3,930 at week’s end. If the SPX breaks below this range, look for the 3,835 to 3,850 area to come into play, which is the site of an extended trendline drawn through lower highs in February. The closing level ahead of the breakout above this trendline two weeks ago was at 3,875 and, as such, adds another level of support before 3,835-3,850 comes into play. Coincidentally, the SPX’s 40-day moving average is sitting at 3,875.

In fact, after a spike in the equity-only, buy-to-open put/call volume ratio to multi-month highs, a subsequent decline in this ratio paves the way for the SPX to advance from the support last week, as increasing short-term trader skepticism peaked.
But the peak occurred at a relatively low level, suggesting the market may quickly become vulnerable after only a minimal advance.

After Thursday’s trading, my volume on CNBC was on, but my back was to the television. I heard many guests indicate the big-cap technology pullback was a buying opportunity. From that perspective only, I would advise being careful if treading into those waters.
However, the 10-day buy-to-open put/call volume ratio on Nasdaq-100 Index (NDX - 12,866.99) components only spiked to near its November high, and is now rolling over. Similar action in this ratio was a buying opportunity in November, so there is a sentiment-based bullish case.

If you are looking for technical permission to enter a bullish, large-cap technology trade, which is advised, I think it is best if you look for resistance that I discussed last week to get taken out. Specifically, and per the chart below, look for the NDX to climb back above a combination of its 40-day moving average, which marked last week’s peak. Plus, the 13,000 level and 13,037, which is a 50% Fibonacci retracement of the recent closing high and low, remain significant.
In the meantime, good luck on your brackets. While most of you will not leverage your investment in the tournament games, remember that options give you that year-round leverage you are seeking. And with the VIX recently coming off its lowest level in months, and earnings season passed, options are cheap.

Read Full Story »»»
 DiscoverGold
Information posted to this board is not meant to suggest any specific action, but to point out the technical signs that can help our readers make their own specific decisions. Caveat emptor!
• DiscoverGold
Join the InvestorsHub Community
Register for free to join our community of investors and share your ideas. You will also get access to streaming quotes, interactive charts, trades, portfolio, live options flow and more tools.

