


| Followers | 689 |
| Posts | 143817 |
| Boards Moderated | 35 |
| Alias Born | 03/10/2004 |
Wednesday, March 03, 2021 5:44:29 PM
Has Apple's Road To $150 Taken A Detour?
By: Dr. Arnout ter Schure | March 3, 2021
In my last article on Apple (NASDAQ:AAPL), I found it had adhered almost perfectly to the ideal Fibonacci-based Elliott Wave Principle count for quite some time, and that it, therefore, should bottom ideally around $129.50 before heading to $151.60.
However, Apple traded down to $118 last week and invalidated the "wave-4, 5" set up.
See Figure 1 below.
Because the EWP and any technical analyses, for that matter, are all about "anticipate, monitor and adjust if necessary," the decline last week forces me to adjust my EWP count on Apple. In this update, I have also included Apple's weekly and monthly charts for improved analyses, as different timeframes need to have aligned EWP counts.
Figure 1. Apple daily candlestick chart with technical indicators and preferred Elliott Wave count:
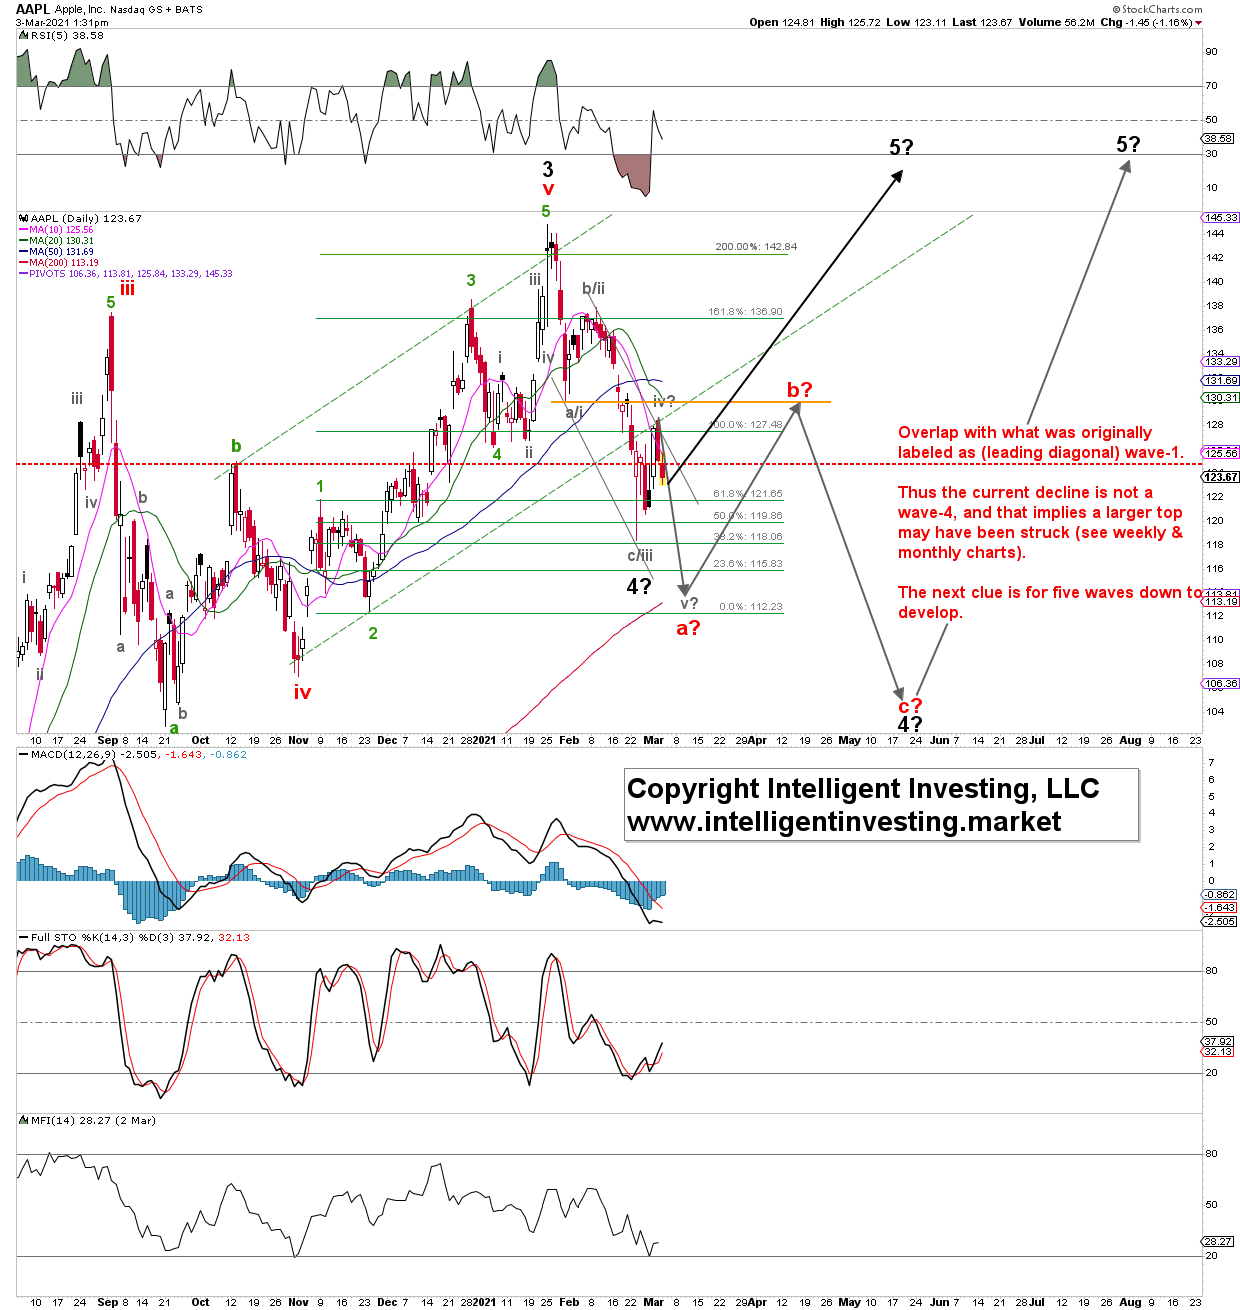
Apple Daily Candlestick Chart.
As said, the current decline is now too deep for a 4th wave. I have adjusted my EWP count to suggest the late-October low was a failed c-wave (does not end below the prior a-wave, the September low in this case). The stock then rallied clearly in a lovely Fibonacci-based impulse pattern to its recent all-time-high, struck two days before its "best-ever" earnings release on Jan. 27. Several other high-flying stocks (Amazon (NASDAQ:AMZN), Facebook (NASDAQ:FB), Tesla (NASDAQ:TSLA)) are now also down double-digits on good earnings, showing that only relying on fundamentals is neither flawless trading and investing strategy.
Back to Apple. It currently has two options, as shown by the black and grey paths. Either rally from about current levels above the (grey) a/i low made in January to invalidate an impulse down or, indeed, form an impulsive wave down to ideally $115+/-2 to complete (red) intermediate wave-a. Then it should bounce back to resistance at around $130+/-10 for red wave-"b?" followed by another impulse down to $105+/-5 to complete red wave-c of wave-4 as a zigzag.
Figure 2. AAPL weekly and monthly candlestick chart with technical indicators and preferred Elliott Wave count:
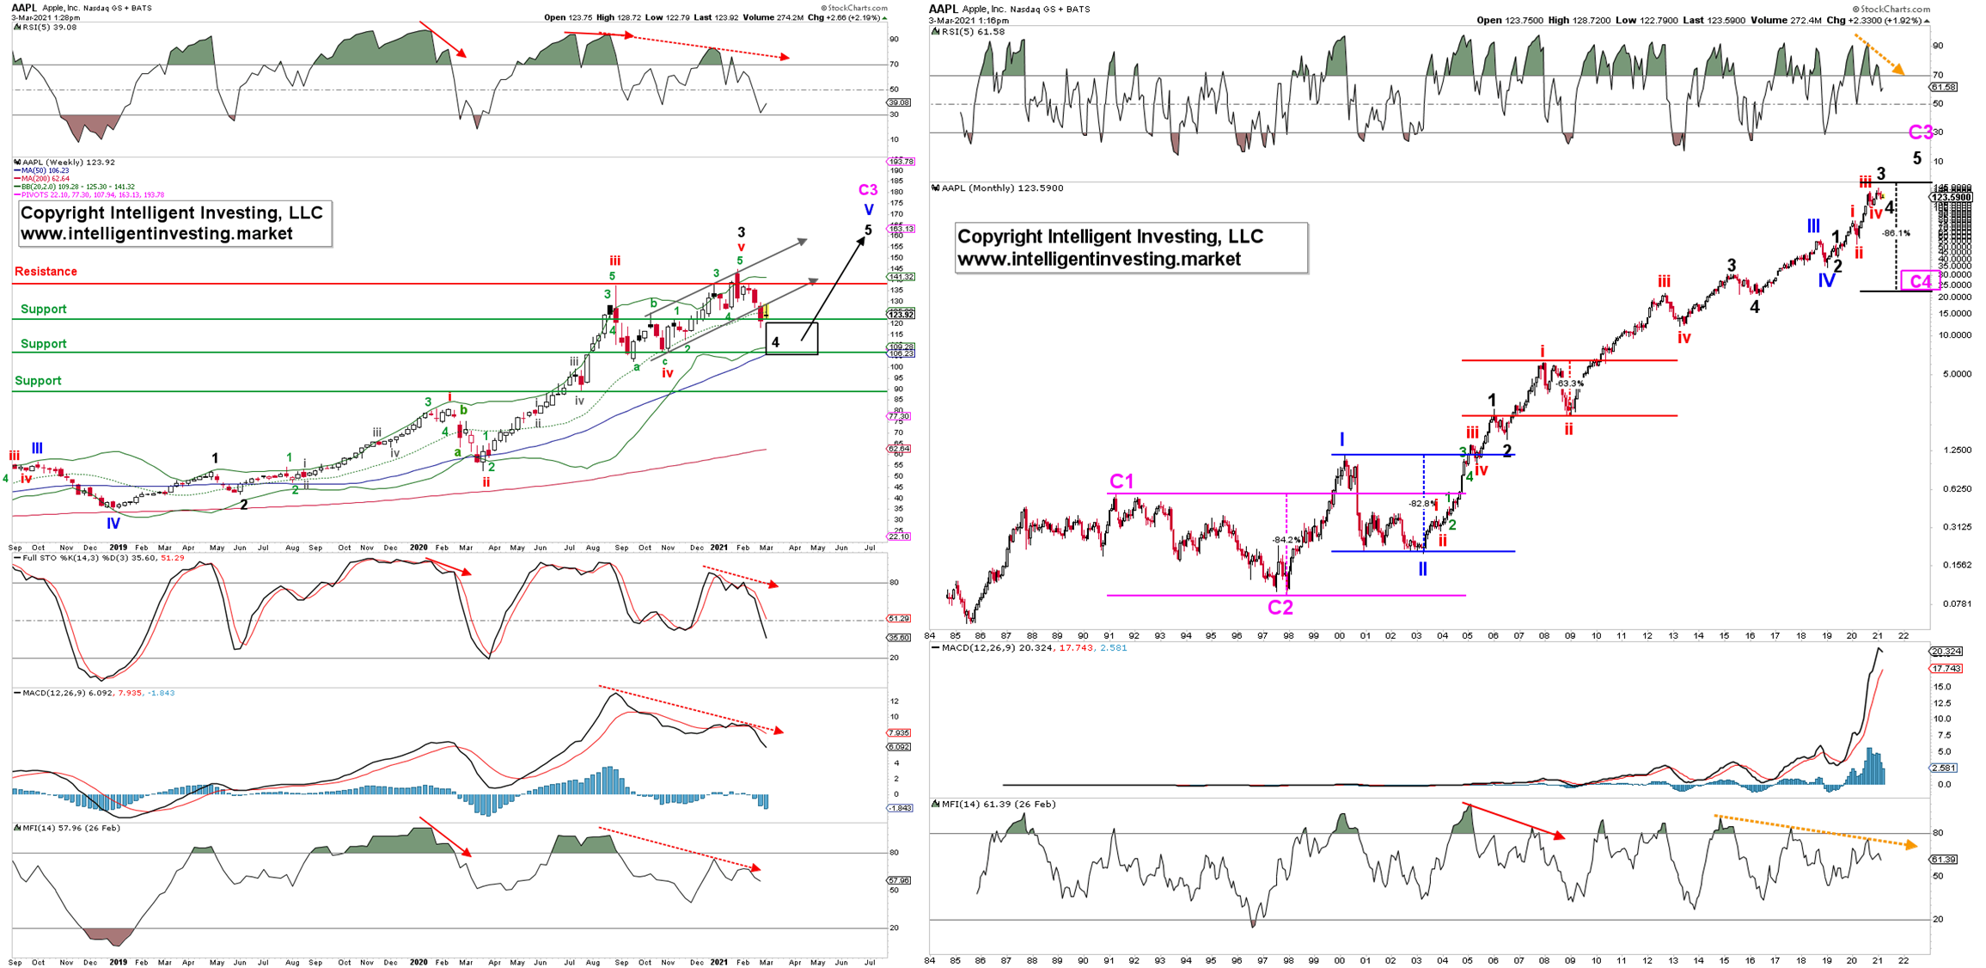
Apple Weekly Chart.
The weekly chart above shows Apple would do an ideal 38.20% retrace of (black) major wave-3 at $105+/-5 (lower end of the black box), typical for the 4th wave of the same degree. Note the negative divergence on all technical indicators, dotted red arrows, strongly suggesting more downside is ahead of the next several weeks. The weekly chart lends itself very well for a coherent, logical EWP count matching the monthly chart.
The monthly chart above, note the log scale, is not any better regarding the negative divergence (orange dotted arrows) and, therefore, also foretells a larger pending correction. Given this chart's timeframe, it is most likely a warning of the (purple) Cycle-4 wave. This wave would bring Apple back to late-2018 levels ($30+/10). Sounds crazy? Not really. Cycle-2 was an 84% haircut, (blue) Primary-II was an 83% decline, and 2008 saw a 63% correction. Other corrective waves were all in the 30-50% range (not shown). Hence, Apple has experienced extensive corrections, and an 80+% drop for a Cycle 4 wave is, therefore, nothing out of the ordinary. If it has happened before, it can happen again. Besides, 4th waves often tend to erase the entire prior one-degree-lower 5th wave, just like the current Major-4 wave is doing. Knowing Primary-V started December 2018 at $35, I expect Cycle-4 will erase all of its gains.
Bottom line: Apple's deeper than anticipated decline forces me to abandon my preferred EWP count and look for lower prices first (ideally around $105+/-5) before the stock is ready to embark on its final rally to $150+. Once reached, it should see a market correction similar to, and of the same wave-degree as, the 83% decline from 1991 to 1997.
Read Full Story »»»
 DiscoverGold
Information posted to this board is not meant to suggest any specific action, but to point out the technical signs that can help our readers make their own specific decisions. Caveat emptor!
• DiscoverGold
Join the InvestorsHub Community
Register for free to join our community of investors and share your ideas. You will also get access to streaming quotes, interactive charts, trades, portfolio, live options flow and more tools.

