


That might require some research....
Involving more than just a goofy chart !
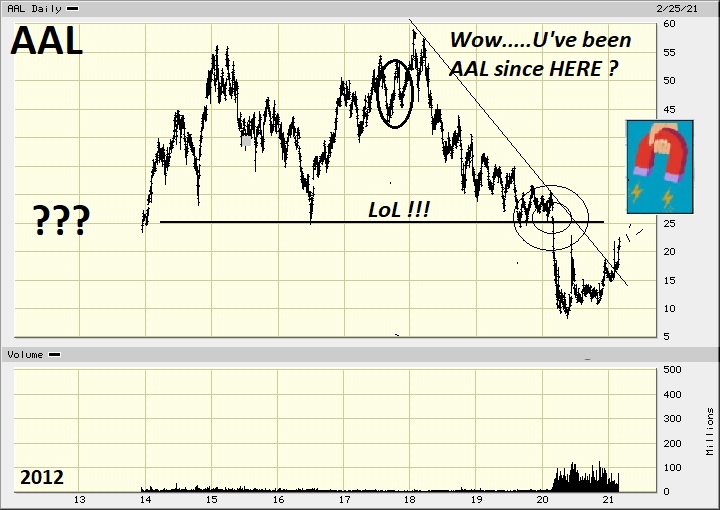
I'd also wanna be looking at DAL and AC
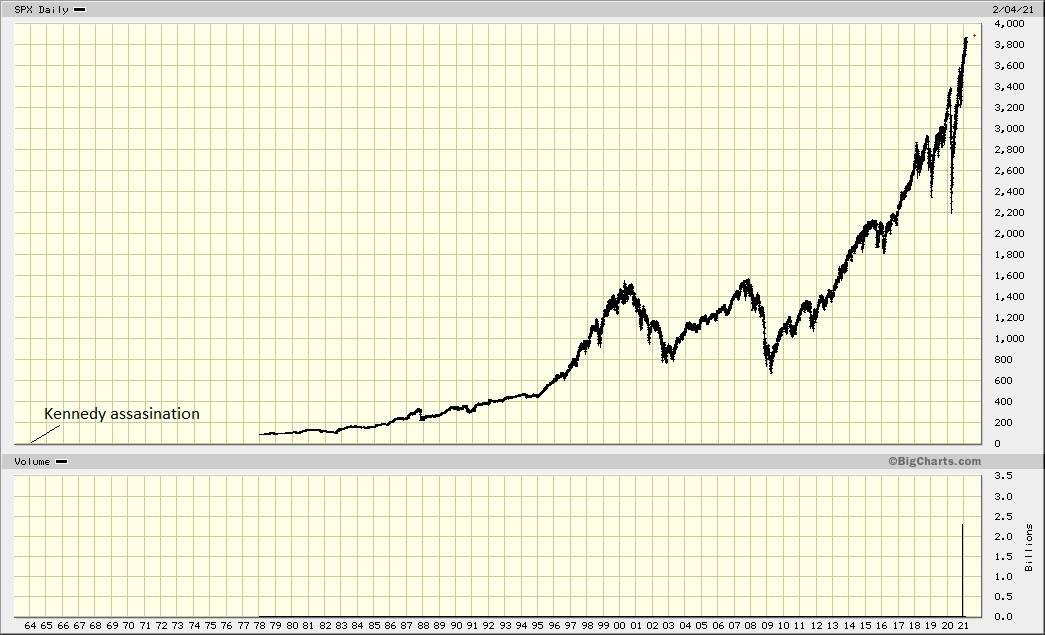
Plus weighing the likelihood of an S&P correction
Factoring in whether this 2wk-old chart, etc. still applies
Okay now I just looked at AC here where its' $25 Buck Level will soon be providing the entire answer to your question !
Sell AAL if AC starts PLUNGING THRU $25
And it'll probably throw some head-fakes - on down thru, just to fool us
https://bigcharts.marketwatch.com/advchart/frames/frames.asp?show=&insttype=&symb=ca%3Aac&x=59&y=14&time=100&startdate=1%2F4%2F2012&enddate=9%2F10%2F2021&freq=1&compidx=aaaaa%3A0&comptemptext=&comp=none&ma=0&maval=50+200&uf=0&lf=1&lf2=0&lf3=0&type=2&style=320&size=3&timeFrameToggle=false&compareToToggle=false&indicatorsToggle=false&chartStyleToggle=false&state=11
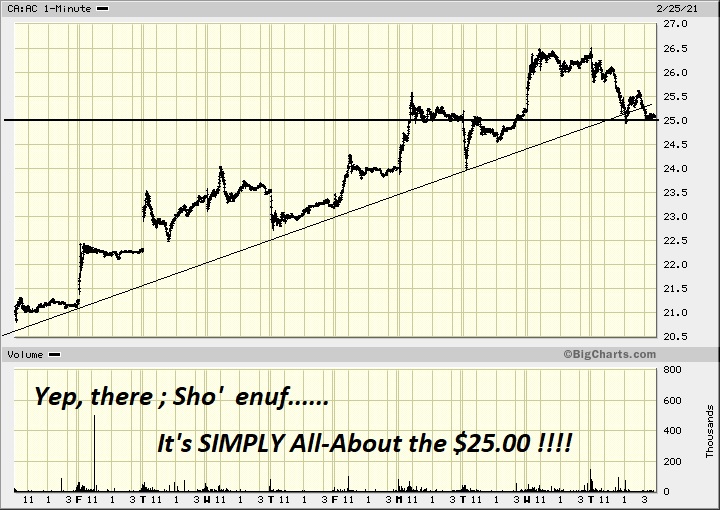
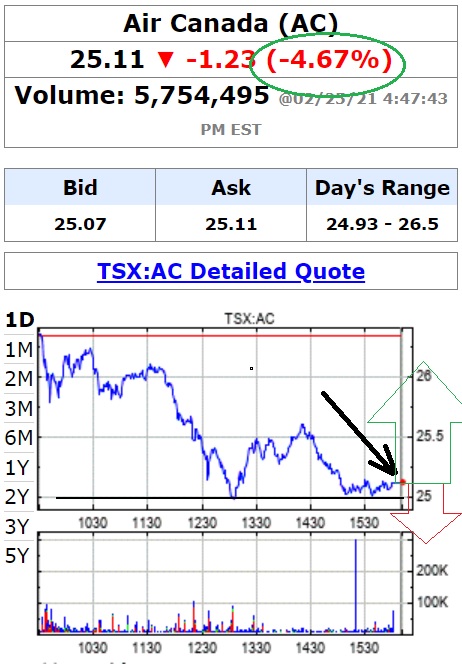
Notice how it has poked thru already = Danger Indicator
I-Hub chart's indistinguishable
Recent AC News
- Form 8-K - Current report • Edgar (US Regulatory) • 09/19/2024 08:27:53 PM
- Associated Capital Group, Inc. Announces Special Dividend of $2 Per Share • GlobeNewswire Inc. • 09/19/2024 03:12:21 PM
- Form 8-K - Current report • Edgar (US Regulatory) • 09/09/2024 08:22:09 PM
- Associated Capital Group Sets Registration Date for 2024 Shareholder Designated Charitable Contribution • GlobeNewswire Inc. • 09/09/2024 08:15:55 PM
- Form 4 - Statement of changes in beneficial ownership of securities • Edgar (US Regulatory) • 08/13/2024 08:02:52 PM
- Form 4 - Statement of changes in beneficial ownership of securities • Edgar (US Regulatory) • 08/13/2024 08:02:15 PM
- Form 10-Q - Quarterly report [Sections 13 or 15(d)] • Edgar (US Regulatory) • 08/09/2024 09:14:34 PM
- Form 8-K - Current report • Edgar (US Regulatory) • 08/08/2024 08:16:57 PM
- Associated Capital Group, Inc. Reports Second Quarter Results • GlobeNewswire Inc. • 08/07/2024 09:21:06 PM
- AC Reports Preliminary June 30 Book Value of $42.75 to $42.95 Per Share • GlobeNewswire Inc. • 07/08/2024 09:07:23 PM
- Form 8-K - Current report • Edgar (US Regulatory) • 06/05/2024 09:05:37 PM
- Form 8-K - Current report • Edgar (US Regulatory) • 05/14/2024 09:02:50 PM
- Associated Capital Group, Inc. Reports Increased First Quarter Book Value • GlobeNewswire Inc. • 05/09/2024 09:00:08 PM
- Form ARS - Annual Report to Security Holders • Edgar (US Regulatory) • 05/09/2024 08:15:30 PM
- AC Reports Preliminary March 31 Book Value of $42.67 to $42.87 Per Share • GlobeNewswire Inc. • 04/05/2024 08:30:08 PM
- Form 8-K - Current report • Edgar (US Regulatory) • 02/09/2024 10:02:10 PM
- Associated Capital Group, Inc. Reports Fourth Quarter and Full Year Results • GlobeNewswire Inc. • 02/07/2024 12:07:28 AM
- Form 8-K - Current report • Edgar (US Regulatory) • 01/11/2024 10:05:20 PM
- Associated Capital Reports Estimated Fourth Quarter and Full Year Results • GlobeNewswire Inc. • 01/10/2024 12:30:28 PM
- Form 8-K - Current report • Edgar (US Regulatory) • 11/13/2023 10:29:37 PM
- Form 8-K - Current report • Edgar (US Regulatory) • 11/13/2023 10:12:57 PM
- Associated Capital Group, Inc. Reports Third Quarter Results • GlobeNewswire Inc. • 11/08/2023 11:30:41 PM
- Associated Capital Group, Inc. Announces Changes to Management Team • GlobeNewswire Inc. • 11/08/2023 11:25:02 PM
- Form 8-K - Current report • Edgar (US Regulatory) • 10/12/2023 08:24:35 PM
- AC Reports Preliminary September 30 Book Value of $41.35 to $41.55 Per Share • GlobeNewswire Inc. • 10/09/2023 09:05:18 PM
North Bay Resources Commences Operations at Bishop Gold Mill, Inyo County, California; Engages Sabean Group Management Consulting • NBRI • Sep 25, 2024 9:15 AM
CEO David B. Dorwart Anticipates a Bright Future at Good Gaming Inc. Through His Most Recent Shareholder Update • GMER • Sep 25, 2024 8:30 AM
Cannabix Technologies and Omega Laboratories Inc. Advance Marijuana Breathalyzer Technology - Dr. Bruce Goldberger to Present at Society of Forensic Toxicologists Conference • BLOZF • Sep 24, 2024 8:50 AM
Integrated Ventures, Inc Announces Strategic Partnership For GLP-1 (Semaglutide) Procurement Through MedWell USA, LLC. • INTV • Sep 24, 2024 8:45 AM
Avant Technologies Accelerates Creation of AI-Powered Platform to Revolutionize Patient Care • AVAI • Sep 24, 2024 8:00 AM
VHAI - Vocodia Partners with Leading Political Super PACs to Revolutionize Fundraising Efforts • VHAI • Sep 19, 2024 11:48 AM

