


| Followers | 689 |
| Posts | 143817 |
| Boards Moderated | 35 |
| Alias Born | 03/10/2004 |
Sunday, December 27, 2020 8:59:10 AM
By: Lyn Alden Schwartzer | December 22, 2020
Tobacco Stocks: Cheap and High-Yielding
Garrett recently posted a bunch of setups about rotation plays, the two that I like a lot fundamentally are both tobacco-related (even if I hate their products).
British American Tobacco (BTI) is extraordinarily cheap, pays a high yield, and consensus analyst expectations are for earnings growth:

Chart Source: F.A.S.T. Graphs
If we look at raw free cash flow, it also looks great:
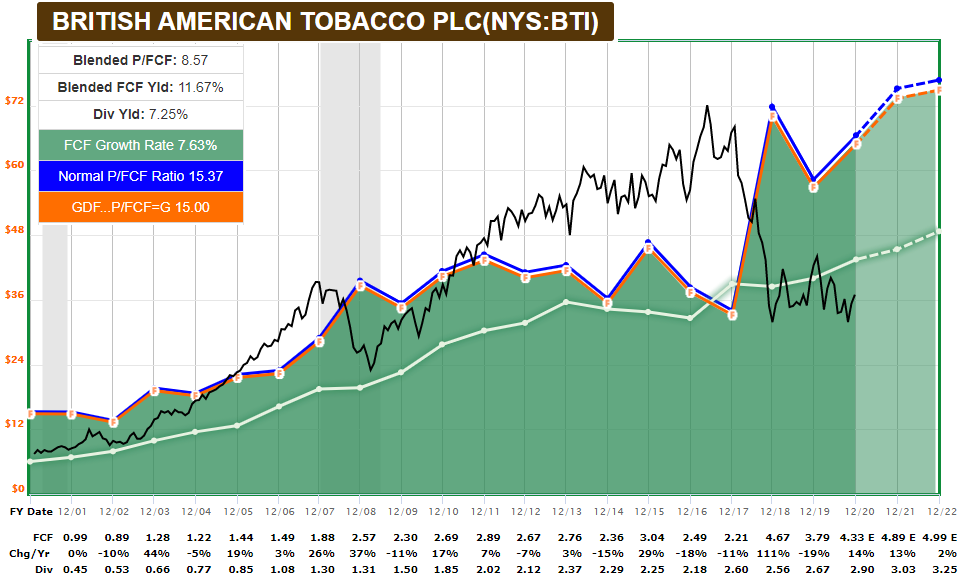
Chart Source: F.A.S.T. Graphs
Ever since their big Reynolds acquisition, some of BTI’s metrics have been a bit wonky, because it takes time to digest such a large acquisition. For example, debt/EBITDA increased, while debt/assets decreased from the acquisition point:
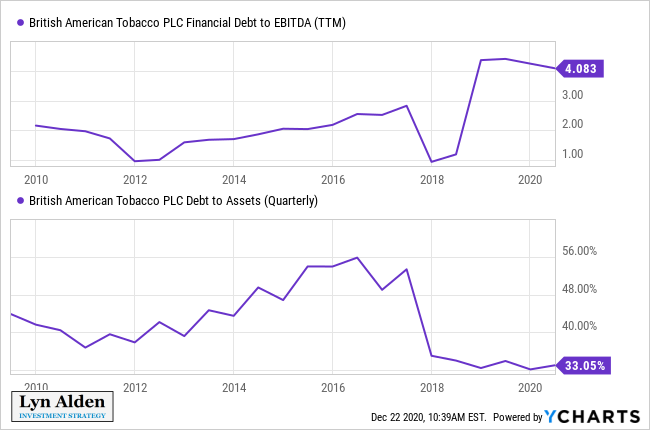
Over time, BTI will keep consolidating its operations and balance sheet, and is generating plenty of cash for dividends. It’s not a sexy stock pick, but it has outperformed for decades, and after the past five years of severe underperformance, is extremely cheap relative to its fundamentals.
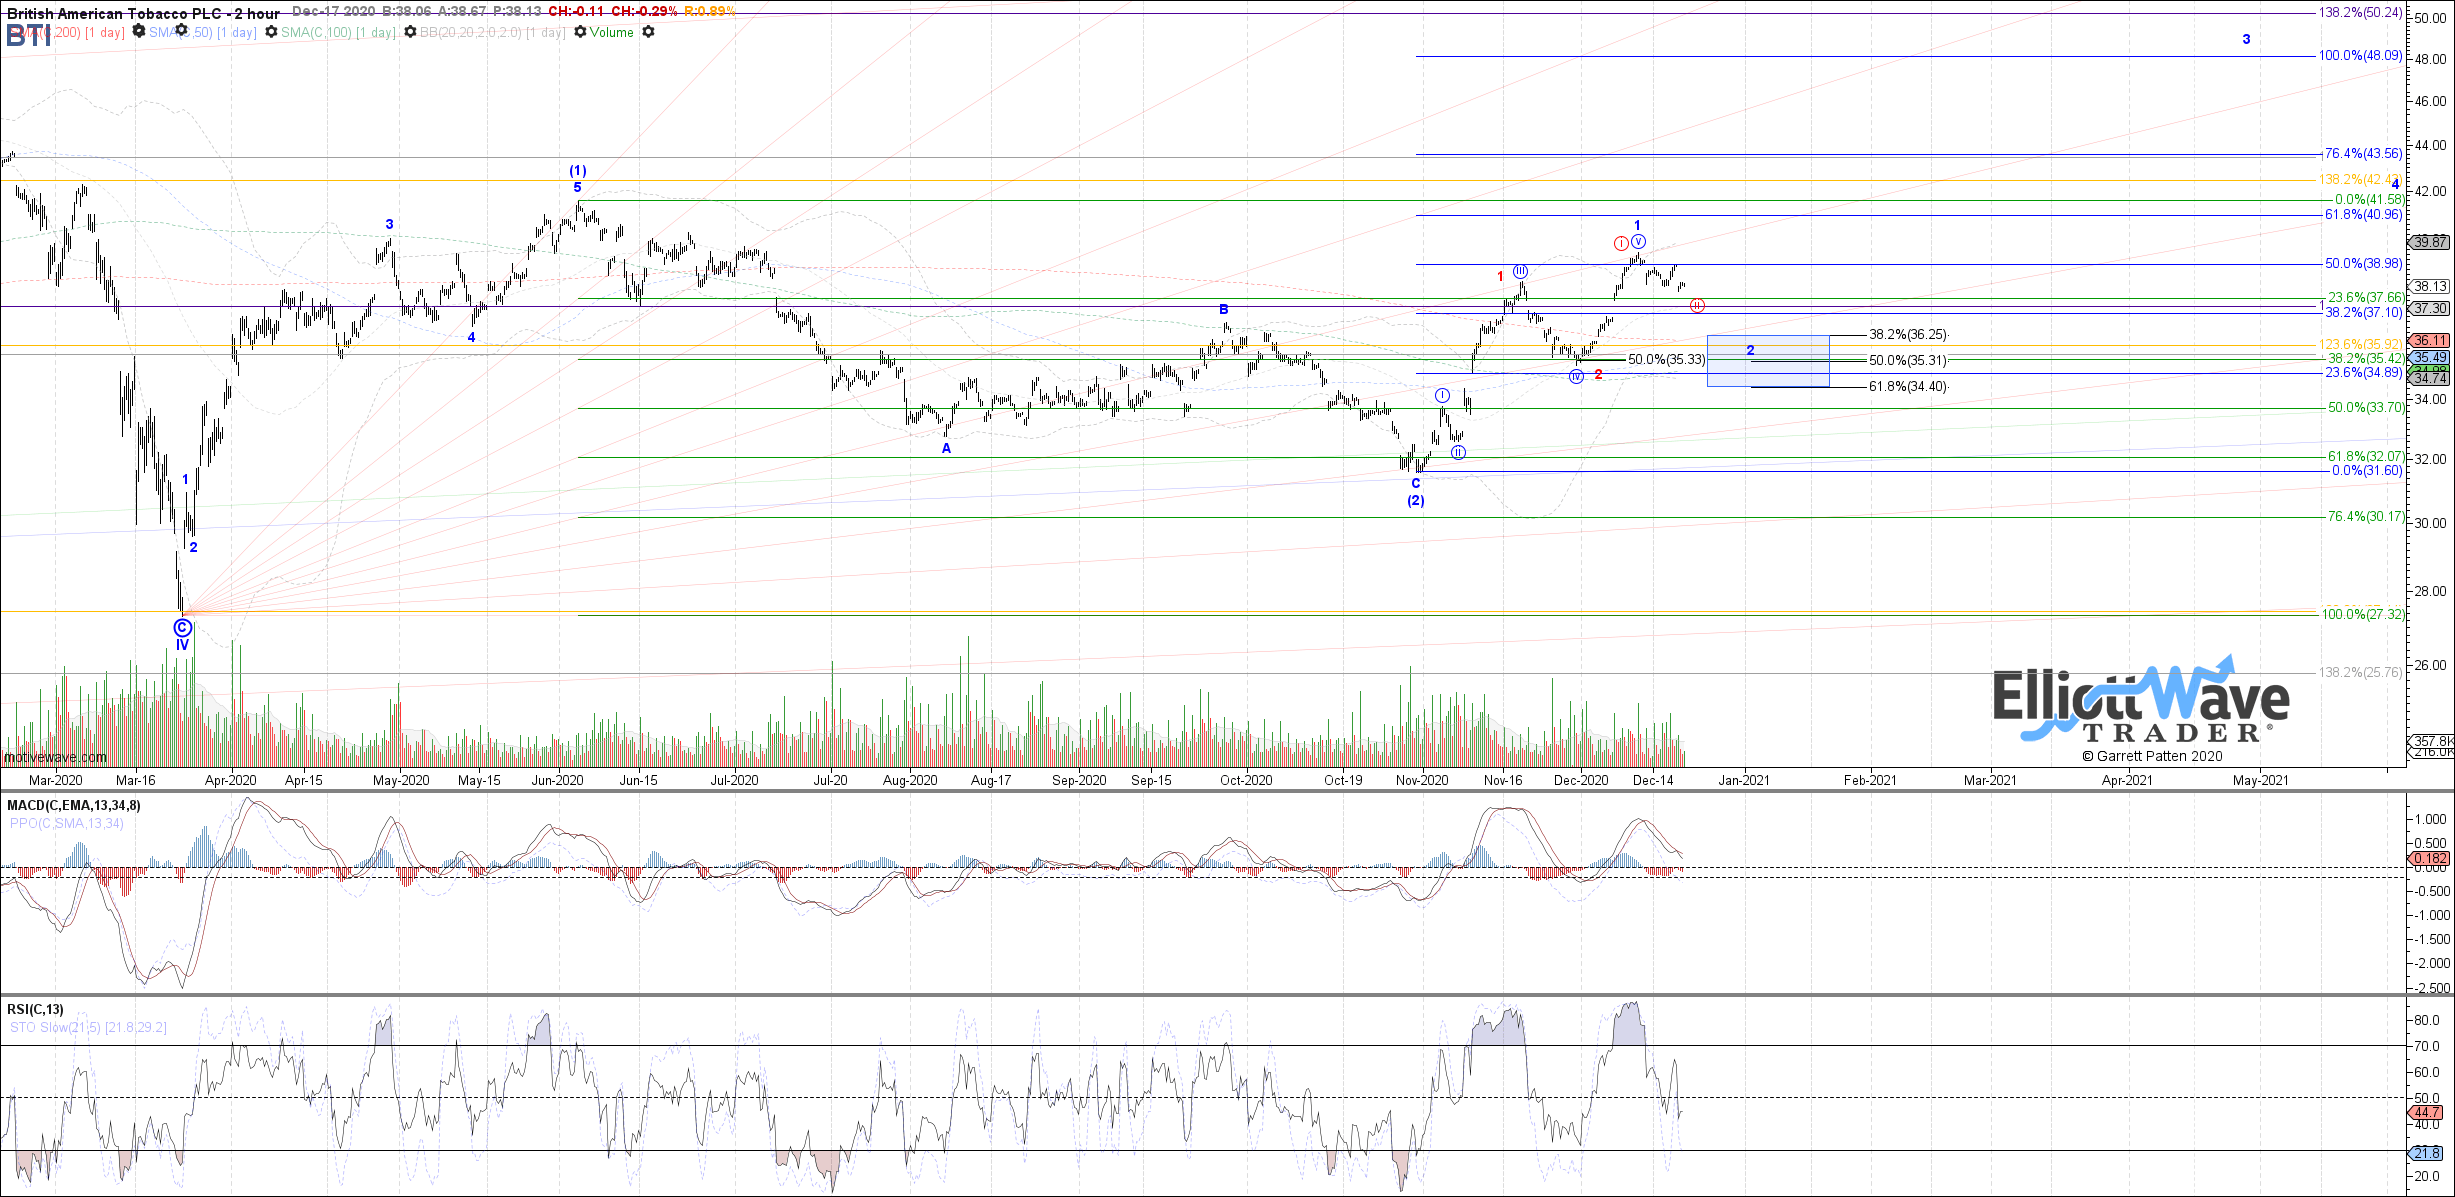
Garrett has a positive setup for it:
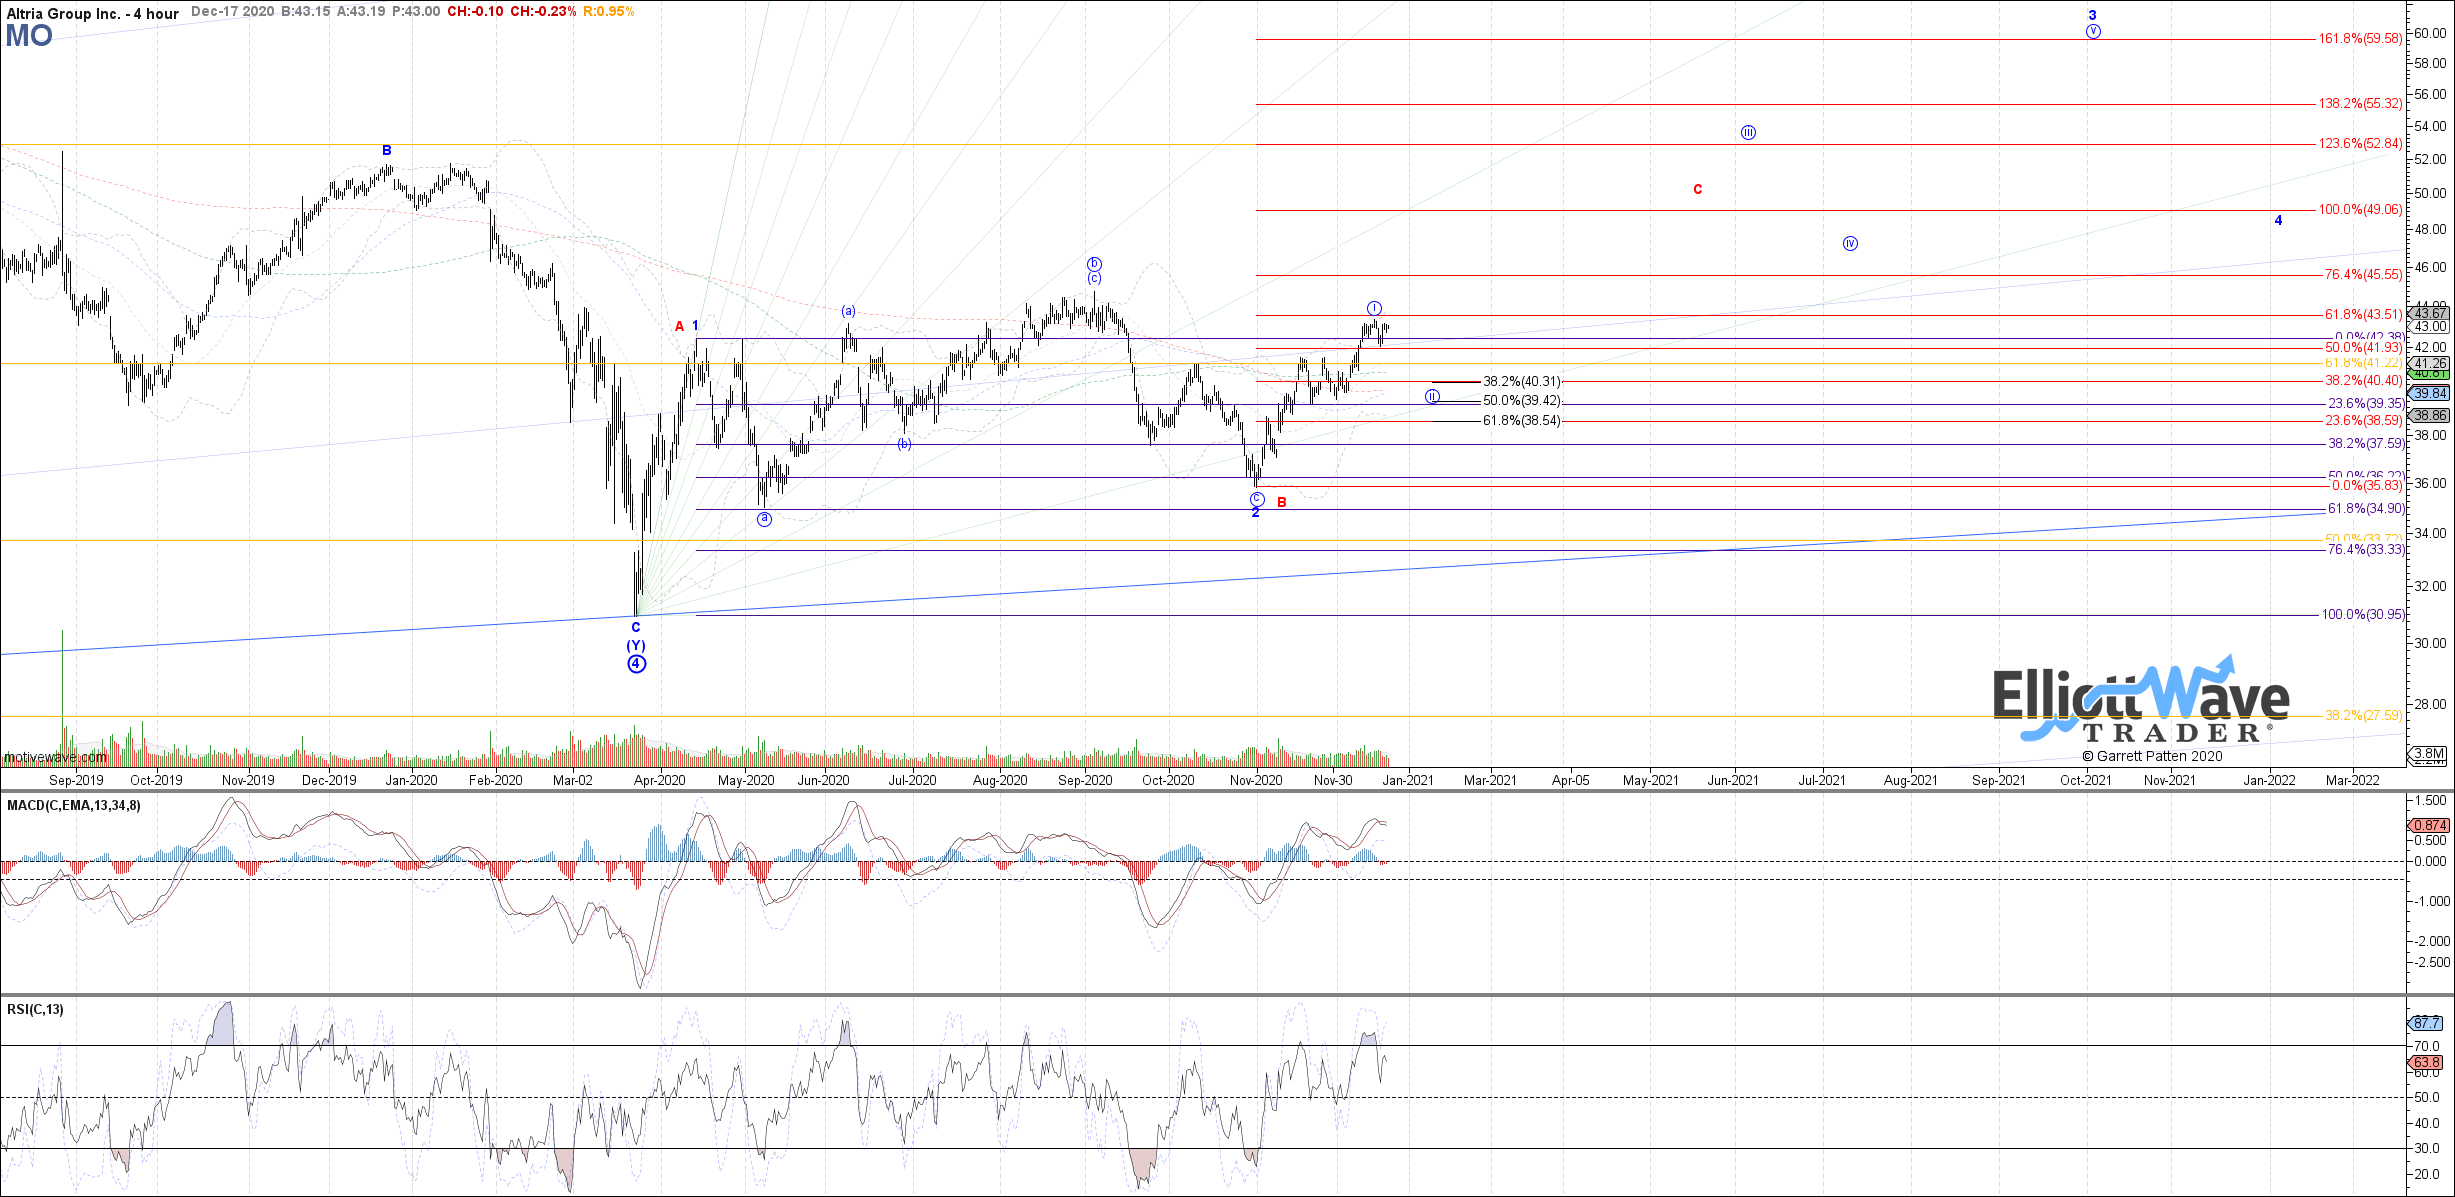
Likewise, Altria (MO) has a similar fundamental chart:
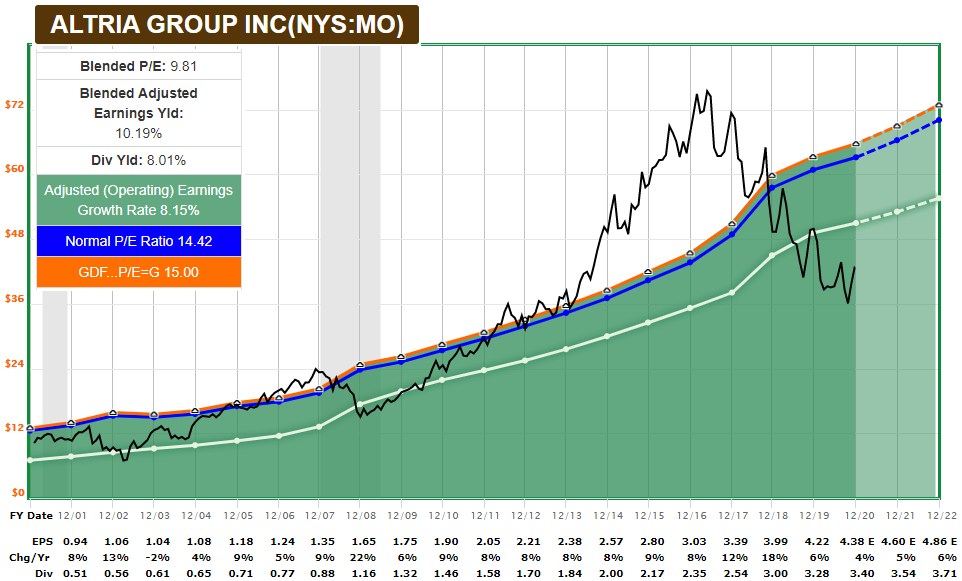
Chart Source: F.A.S.T. Graphs
And Garrett has a similar setup for it:
I prefer BTI due to its global exposure, but holding a small collection of cheap tobacco stocks is rational as well. Many high-yield stocks are banks or energy or real estate related, so a couple small tobacco stock positions can add a bit of diversification to a yield-centered portfolio.
More broadly, there is potential growth-to-value rotation occurring. It could be another fake-out, but given the big shift in fiscal and monetary policy this year, along with the unusually wide valuation gap between growth and value stocks, this one could have real potential:
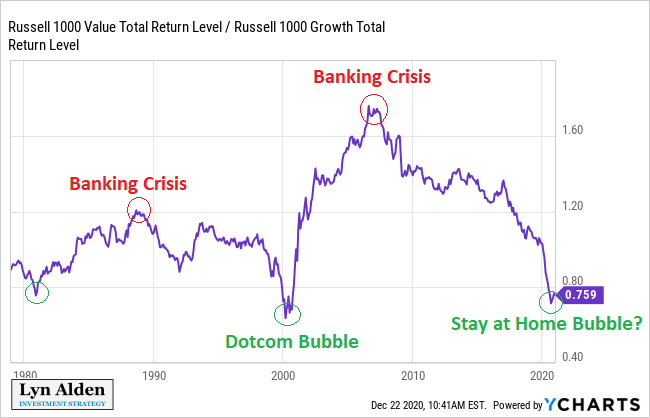
When the line is going up, it means value is outperforming, and when the line is going down, it means growth is outperforming.
Read Full Story »»»
 DiscoverGold
Information posted to this board is not meant to suggest any specific action, but to point out the technical signs that can help our readers make their own specific decisions. Caveat emptor!
• DiscoverGold
Recent MO News
- Altria and NJOY Respond to ITC Initial Determination in Complaint Against NJOY • Business Wire • 08/27/2024 12:00:00 PM
- Cruise and Uber Join Forces for Robotaxis, Alibaba Shifts Primary Listing to Hong Kong, Altria Hikes Dividend 4.1% • IH Market News • 08/23/2024 12:20:26 PM
- Altria Increases Quarterly Dividend by 4.1% to $1.02 Per Share • Business Wire • 08/22/2024 05:15:00 PM
- Form 10-Q - Quarterly report [Sections 13 or 15(d)] • Edgar (US Regulatory) • 07/31/2024 11:23:37 AM
- Form 8-K - Current report • Edgar (US Regulatory) • 07/31/2024 11:02:01 AM
- Altria Reports 2024 Second-Quarter and First-Half Results; Narrows 2024 Full-Year Earnings Guidance • Business Wire • 07/31/2024 11:00:00 AM
- US Index Futures Up Ahead of Fed Decision; Oil Prices Surge Amid Middle East Tensions • IH Market News • 07/31/2024 10:01:30 AM
- Altria to Host Webcast of 2024 Second-Quarter and First-Half Results • Business Wire • 07/17/2024 02:00:00 PM
- Altria Announces PMTA Submission for on! PLUS™ Nicotine Pouches • Business Wire • 06/26/2024 08:52:00 PM
- UPS Divests Coyote Logistics in $1.025 Billion Deal with RXO, Under Armour Agrees to $434 million Settlement, and More News • IH Market News • 06/24/2024 11:00:20 AM
- NJOY Receives First FDA Authorizations for Menthol E-Vapor Products • Business Wire • 06/21/2024 10:17:00 PM
- Form 11-K - Annual report of employee stock purchase, savings and similar plans • Edgar (US Regulatory) • 06/07/2024 04:58:50 PM
- Form 11-K - Annual report of employee stock purchase, savings and similar plans • Edgar (US Regulatory) • 06/07/2024 04:57:12 PM
- Form 10-K/A - Annual report [Section 13 and 15(d), not S-K Item 405]: [Amend] • Edgar (US Regulatory) • 06/05/2024 05:23:49 PM
- NJOY Submits Premarket Tobacco Product Applications to the FDA for NJOY ACE 2.0 Featuring Bluetooth®-enabled Access Restriction Technology • Business Wire • 05/20/2024 08:15:00 PM
- Form 8-K - Current report • Edgar (US Regulatory) • 05/20/2024 06:47:54 PM
- Form 4 - Statement of changes in beneficial ownership of securities • Edgar (US Regulatory) • 05/20/2024 06:47:27 PM
- Form 4 - Statement of changes in beneficial ownership of securities • Edgar (US Regulatory) • 05/20/2024 06:47:13 PM
- Form 4 - Statement of changes in beneficial ownership of securities • Edgar (US Regulatory) • 05/20/2024 06:46:55 PM
- Form 4 - Statement of changes in beneficial ownership of securities • Edgar (US Regulatory) • 05/20/2024 06:46:40 PM
- Form 4 - Statement of changes in beneficial ownership of securities • Edgar (US Regulatory) • 05/20/2024 06:46:27 PM
- Form 4 - Statement of changes in beneficial ownership of securities • Edgar (US Regulatory) • 05/20/2024 06:46:14 PM
- Form 4 - Statement of changes in beneficial ownership of securities • Edgar (US Regulatory) • 05/20/2024 06:46:00 PM
- Form 4 - Statement of changes in beneficial ownership of securities • Edgar (US Regulatory) • 05/20/2024 06:45:50 PM
- Form 4 - Statement of changes in beneficial ownership of securities • Edgar (US Regulatory) • 05/20/2024 06:45:36 PM
VHAI - Vocodia Partners with Leading Political Super PACs to Revolutionize Fundraising Efforts • VHAI • Sep 19, 2024 11:48 AM
Dear Cashmere Group Holding Co. AKA Swifty Global Signs Binding Letter of Intent to be Acquired by Signing Day Sports • DRCR • Sep 19, 2024 10:26 AM
HealthLynked Launches Virtual Urgent Care Through Partnership with Lyric Health. • HLYK • Sep 19, 2024 8:00 AM
Element79 Gold Corp. Appoints Kevin Arias as Advisor to the Board of Directors, Strengthening Strategic Leadership • ELMGF • Sep 18, 2024 10:29 AM
Mawson Finland Limited Further Expands the Known Mineralized Zones at Rajapalot: Palokas step-out drills 7 metres @ 9.1 g/t gold & 706 ppm cobalt • MFL • Sep 17, 2024 9:02 AM
PickleJar Announces Integration With OptCulture to Deliver Holistic Fan Experiences at Venue Point of Sale • PKLE • Sep 17, 2024 8:00 AM

