


| Followers | 689 |
| Posts | 143817 |
| Boards Moderated | 35 |
| Alias Born | 03/10/2004 |
Friday, October 30, 2020 4:17:46 PM
By: SentimenTrader | October 30, 2020
Energy has been one of the most consistently losing sectors out of any sector since 1928. It's also suffered one of the largest drawdowns. Looking at each sector's maximum loss from its latest multi-year peak can be instructive, but it's better to look at it relative to the drawdown of the broader S&P 500 index.
Below, we can see two sectors' maximum decline from a 3-year high, minus the drawdown in the S&P 500 index. So, it shows losses that investors suffered beyond what they would have been exposed to in the broader market.
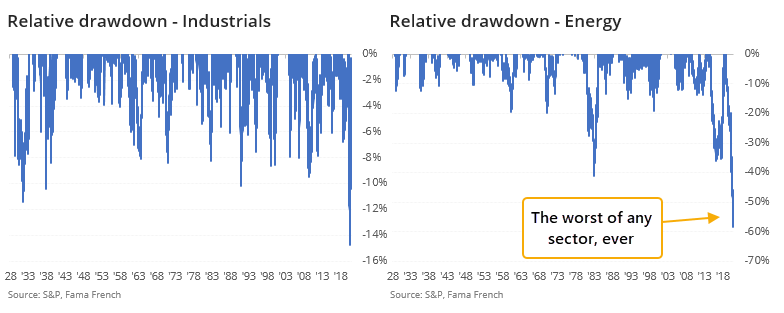
Going back to 1928, it has been unusual to see any sector, at any point, to lose 35% more from a high than did the broader market.
The current drawdown in energy is now about 60% more than the S&P's, by far the worst of any sector in history. It exceeds the relative losses in tech after the internet bubble burst and devastation in financials following the Great Financial Crisis.
What else is happening
• All sectors' drawdowns relative to the S&P 500 going back to 1928
• Zoomed-in charts for each sector that reached a certain threshold, and their future relative performance
• What happens after the S&P 500 becomes oversold for the 1st time in months
• More than 10% of S&P 500 stocks are also hitting oversold levels
• Gold is probably facing its first negative quarter in a year
Stat Box
The Relative Strength Index (RSI) is a popular tool among technical analysts. It computes a stock or index's momentum of price gains or losses over (usually) a 14-day time span. A 9-day span is also popular. There are different ways of interpreting it, with a common one being that a reading over 70 suggests a market is overbought, and a reading below 30 is oversold. For the S&P 500, its RSI just fell below 30 for the 1st time in more than 6 months. This has happened 22 times since 1928, and over the next 3 months, the S&P never showed a loss greater than -2%.
Sentiment from other perspectives
We don't necessarily agree with everything posted here - some of our work might directly contradict it - but it's often worth knowing what others are watching.
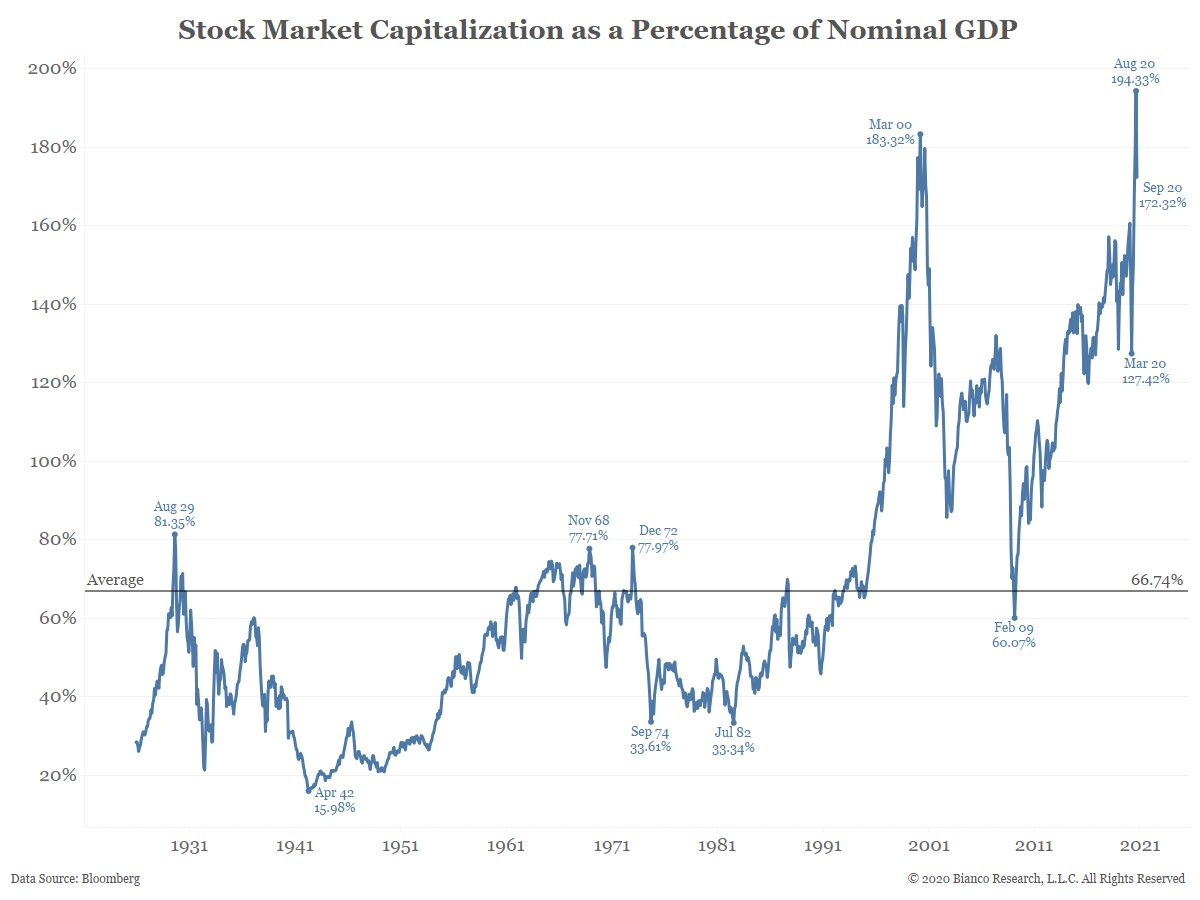
1. With an uptick in GDP, stocks' value versus the economy ticked down but is still at a historic high - Bianco Research
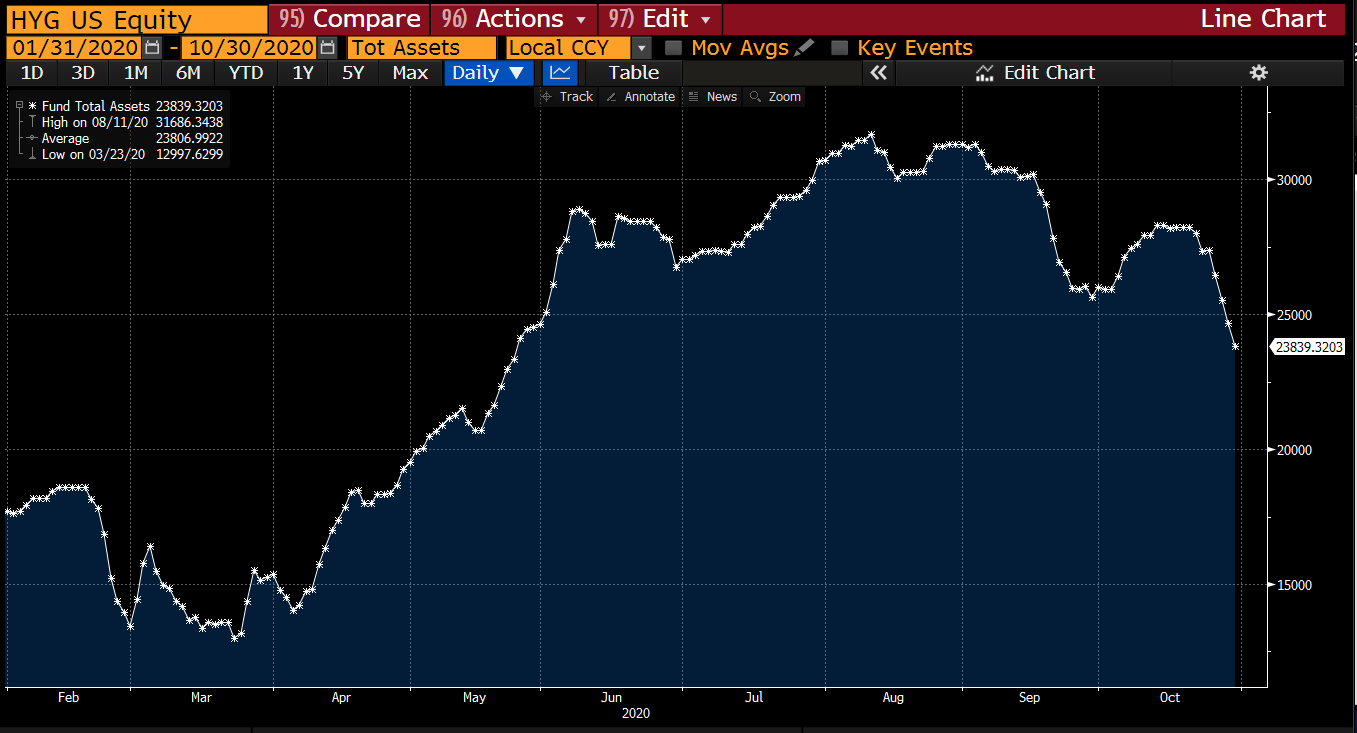
2. Junk bond traders are hightailing it out of their main fund, HYG - Bloomberg
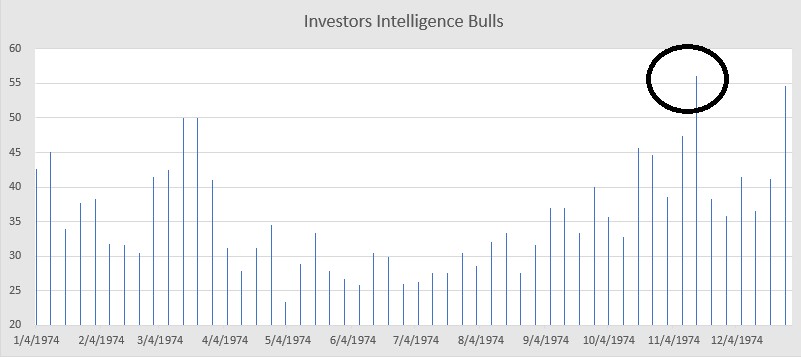
3. Newsletter writers have been pretty, pretty optimistic - Helene Meisler via Realmoney
Investors are confident and volatility is returning. In the video below, Brad Lamensdorf of Active Alts shows why investors may want to freshen up their portfolios for the coming months.
https://dnpgic06wp5lx.cloudfront.net/blog/20201030-132902_1604064542468.jpg
Read Full Story »»»
 DiscoverGold
Information posted to this board is not meant to suggest any specific action, but to point out the technical signs that can help our readers make their own specific decisions. Caveat emptor!
• DiscoverGold
VHAI - Vocodia Partners with Leading Political Super PACs to Revolutionize Fundraising Efforts • VHAI • Sep 19, 2024 11:48 AM
Dear Cashmere Group Holding Co. AKA Swifty Global Signs Binding Letter of Intent to be Acquired by Signing Day Sports • DRCR • Sep 19, 2024 10:26 AM
HealthLynked Launches Virtual Urgent Care Through Partnership with Lyric Health. • HLYK • Sep 19, 2024 8:00 AM
Element79 Gold Corp. Appoints Kevin Arias as Advisor to the Board of Directors, Strengthening Strategic Leadership • ELMGF • Sep 18, 2024 10:29 AM
Mawson Finland Limited Further Expands the Known Mineralized Zones at Rajapalot: Palokas step-out drills 7 metres @ 9.1 g/t gold & 706 ppm cobalt • MFL • Sep 17, 2024 9:02 AM
PickleJar Announces Integration With OptCulture to Deliver Holistic Fan Experiences at Venue Point of Sale • PKLE • Sep 17, 2024 8:00 AM

