* (Click Read Full Story »»» at the bottom of the page for the charts to appear on the post)
SPX Monitoring Purposes: Sold long SPX 8/3/20 = gain 1.49%; Long SPX on 7/30/20 at 3246.22.
Monitoring Purposes GOLD: Long GDX on 7/8/20 at 38.62.
Long Term Trend SPX Monitor Purposes: Short SPX 5/13/20 at 2820.
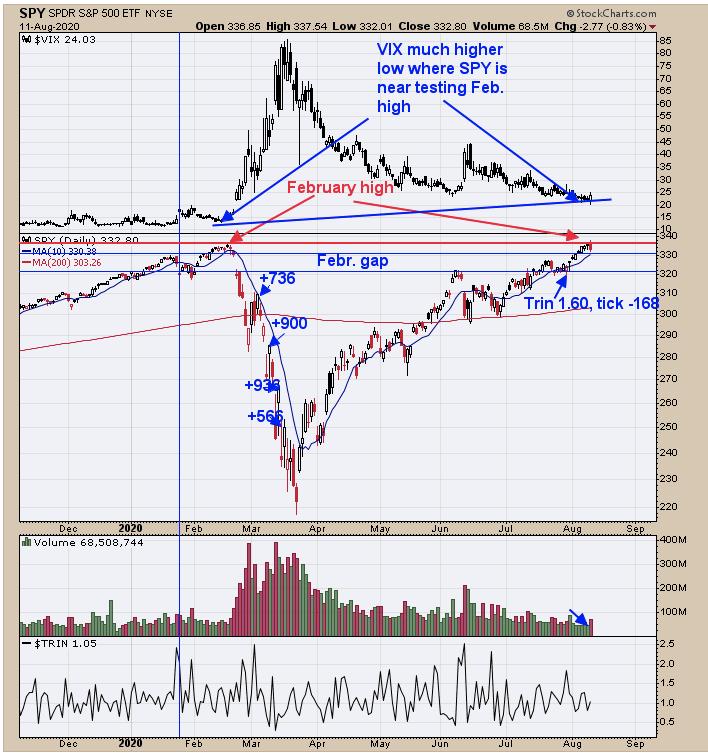
SPY is running into the February high (so far, the SPX has not touched the February High). SPY is matching the February high and the VIX is making a higher low, which, at the moment, is a divergence. The SPY was up 7 days in a row going into yesterday. This much price momentum suggests a higher high will be seen in the next five days. Therefore, if the TICK and TRIN reach extreme levels, a bullish short-term setup could form for a rally above the February high. This potential rally above the February could set up an intermediate-term sell signal if the VIX fails to break below its February low while the SPY is above its February high.
The above chart is on a weekly time frame. The bottom window is the 3-week average of the Equity Put/Call ratio; Reading below .52 have been bearish, and the current reading is .49. The second window down from the top is the weekly RSI. Notice the October 2018 tested the previous January high and produced an RSI divergence, which produced the late-year decline. Weekly SPX is now testing the February high and, so far, there is an RSI divergence. SPX needs to keep rallying for the RSI divergence to go away, which is unlikely. Market could be setting up for a September decline.
On today's decline, the volume jumped nearly 50% compared to the previous day's volume. A jump in volume of 30% or greater compared to the previous day's volume suggests a "Selling Climax." We have marked two previous days going back to April where volume jumped near 30% or greater on a decline. This "Selling Climax" day usually mark a worthwhile low and, since today's "Selling Climax" looks to be over a 50% expansion in volume, that would suggests a rally back to the recent highs, if not higher. We remain intermediate-term bullish. Long GDX on 7/8/20 at 38.62.
Information posted to this board is not meant to suggest any specific action, but to point out the technical signs that can help our readers make their own specific decisions. Caveat emptor! • DiscoverGold
Register for free to join our community of investors and share your ideas. You will also get access to streaming quotes, interactive charts, trades, portfolio, live options flow and more tools.


 News
News  Market Data
  Discover