


| Followers | 689 |
| Posts | 143817 |
| Boards Moderated | 35 |
| Alias Born | 03/10/2004 |
Monday, August 10, 2020 9:23:02 AM
Bulls Chant Into A Megaphone – “All-Time Highs”
By: Lance Roberts | August 8, 2020
Bulls Charge To All-Time Highs
As discussed previously in “Insanely Stupid,” we noted the market remained confined to its consolidation channel, but the bullish bias was to the upside.
“While the market has not been able to push above the recent July highs, support is holding at the rising bullish trend line. With the short-term ‘buy signals’ back in play, the bias at the moment is to the upside.
However, as we have discussed over the last couple of weeks, July held to its historical trends of strength. With a bulk of the S&P 500 earnings season behind us, we suspect the weakening economic data will begin to weigh sentiment in August and September.“
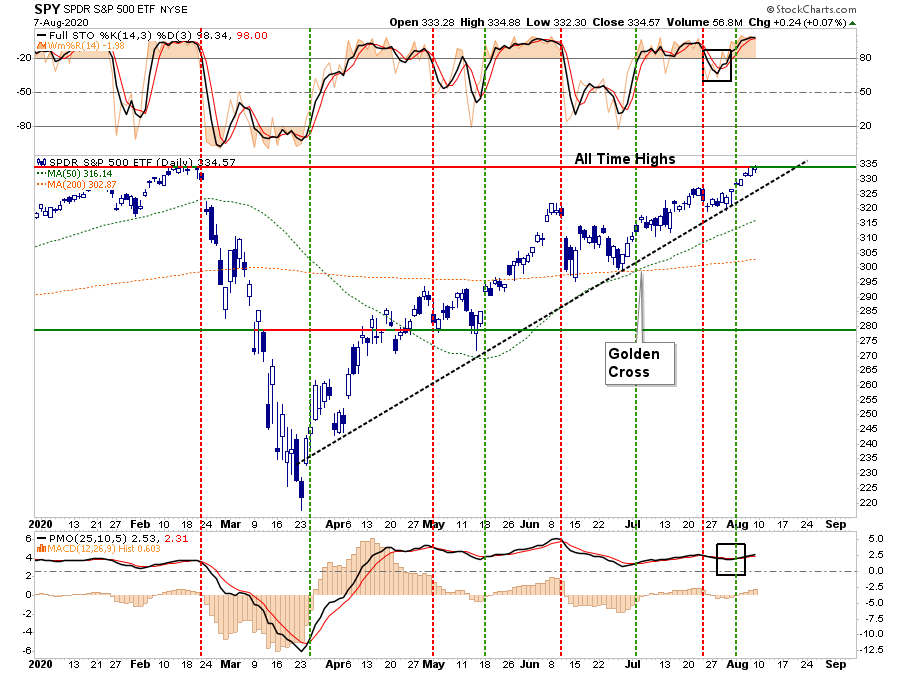
While weaker economic data has not yet dented the “bullish sentiment” at this juncture, it doesn’t mean it won’t. However, as we have discussed over the last several weeks, a breakout of the consolidation range, which was capped by the June highs, would put all-time highs into focus.
A Weighted Distortion
The concern is that what you see with the market, is not necessarily what you get. The chart below shows the number of stocks trading above the 200-dma versus the S&P 500 trading above its 200-dma.
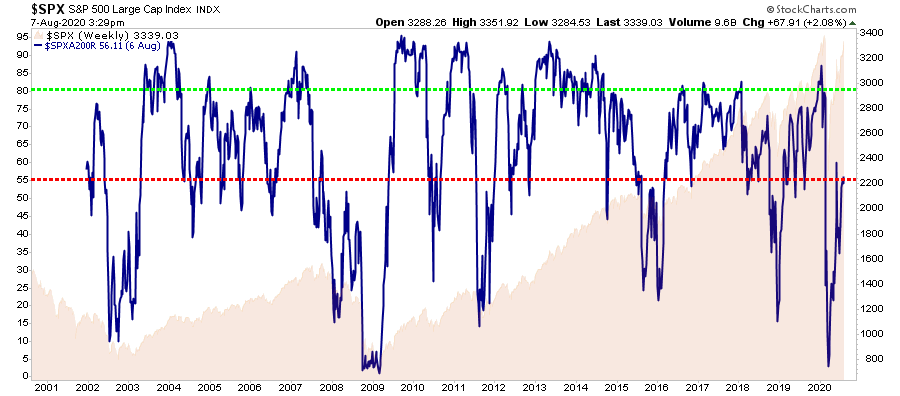
In theory, if the “market” is above its 200-dma, then a large number of stocks, usually about 80%, should also be. However, such is not the case, as only 55% currently do so.
The market is currently being driven to new highs by the “chase” into the largest mega-capitalization stocks. Sentiment Trader noted this on Friday:
“The biggest stock in the U.S. and nearly the world, Apple, keeps powering higher. At the end of June, the value of Apple alone was nearly 80% of the Russell 2000 index’s market capitalization. As of today, it’s nearly 90%. This is astounding – in the past 40 years, no single stock has come close to dwarfing the value of so many other companies.“
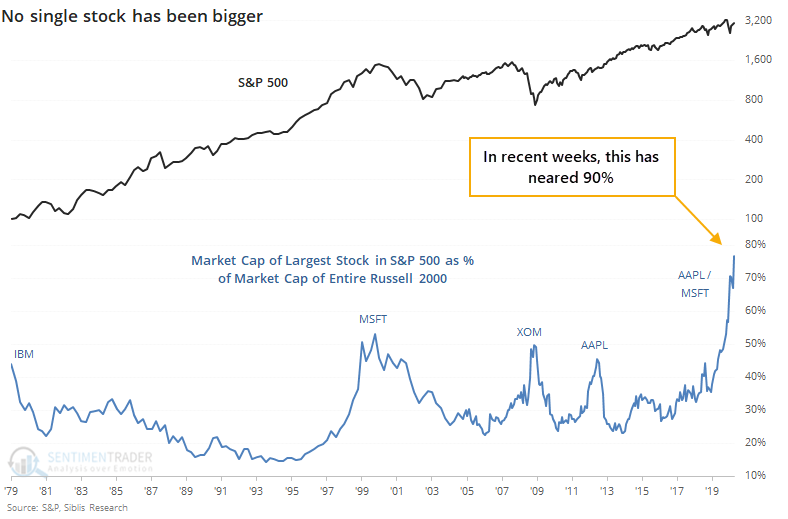
By itself, this data point does not have a lot of historical relevance. However, it does tend to be more of an indication of underlying “exuberance” in the market.
The point here, however, is the top-5 stocks are distorting the overall market participation.
Let Me Explain The Math
Currently, the top-5 S&P stocks by market capitalization (AAPL, AMZN, GOOG, FB, and MSFT) make up the same amount of the S&P 500 as the bottom 394 stocks. Those same five also comprise 26% of the index alone.
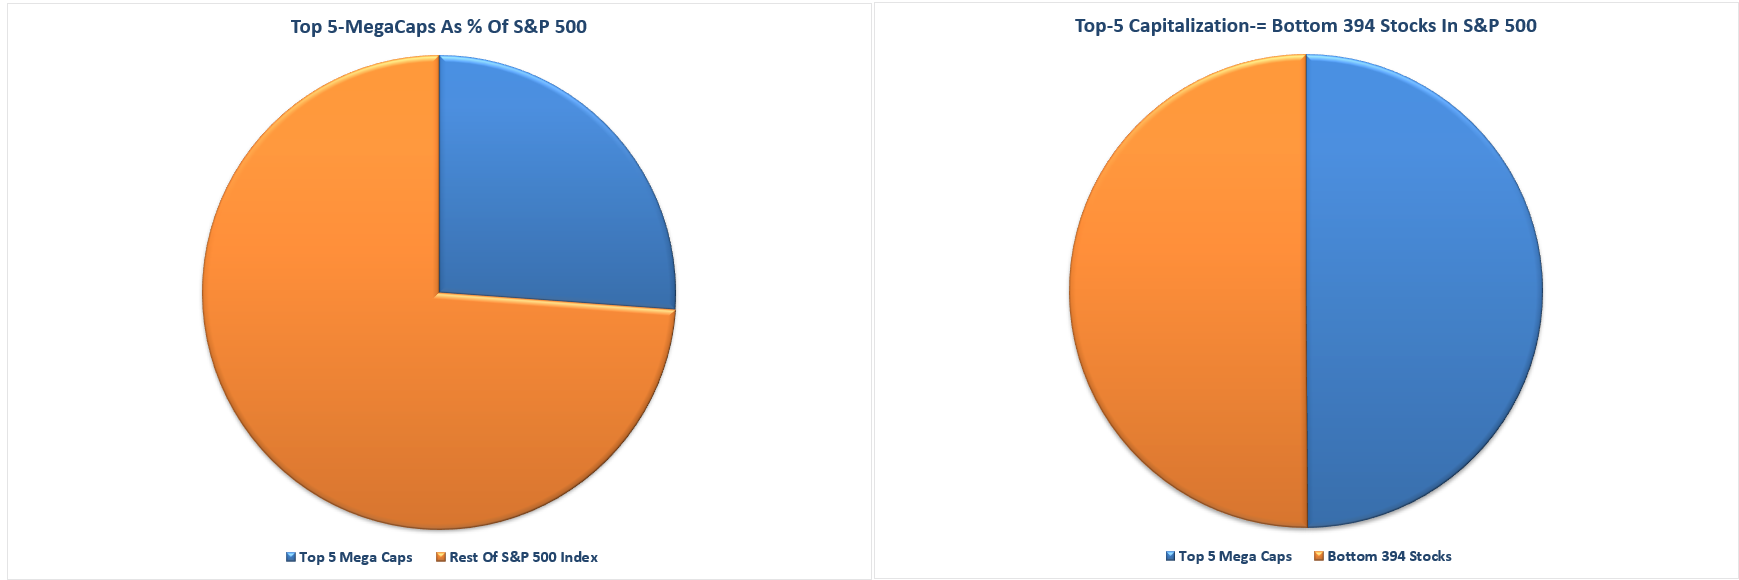
What investors are missing is that the top-5 stocks are distorting the movements in the overall index.
For each $1 put into each of those top-5 stocks, the impact on the index is the same as putting $1 into each of the bottom 394 stocks. Such is clearly not a true representation of either the market or the economy.
As we have noted recently, if you own anything OTHER than those top-5 stocks, your portfolio is likely underperforming the market this year.
Exuberance Abounds
This past week, we discussed with our RIAPro Subscribers (Try Risk-Free for 30-days) the dangers of chasing markets, which have deviated extremely from their long-term means. The risk, of course, is that markets always, without exception, revert to the mean. The only question is the “timing” of the event.
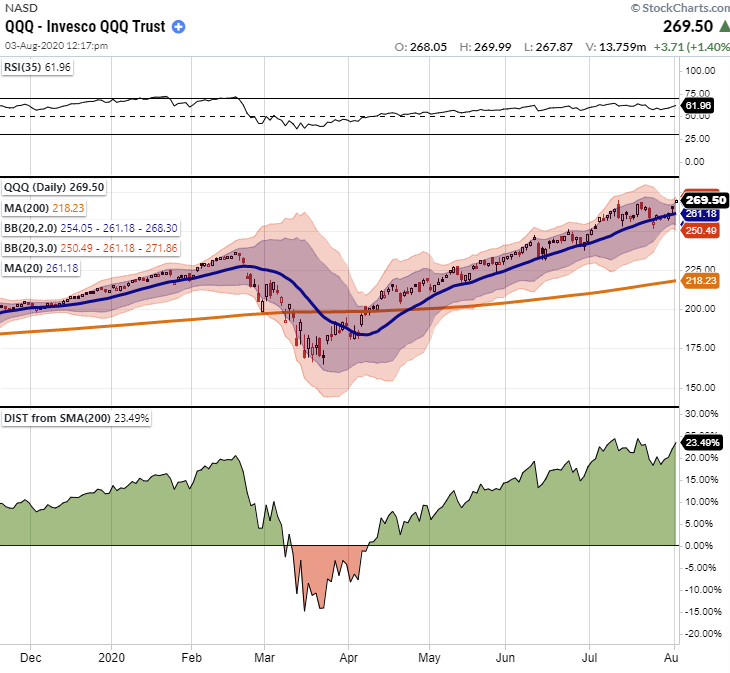
Specifically, we noted the deviation of the Nasdaq from its 200-dma, which remains near a record high.
“Moving averages, especially longer-term ones, are like gravity. The further prices become deviated from long-term averages, the greater the ‘gravitational pull’ becomes. An ‘average’ requires prices to trade above and below the “average” level. The risk of a reversion grows with the size of the deviation.
The Nasdaq currently trades more than 23% above its 200-dma. The last time such a deviation existed was in February of this year. The Nasdaq also trades 3-standard deviations above the 200-dma, which is another extreme indication.
Such does not mean the market is about to crash. However, it does suggest the ‘rubber band’ is stretched so tightly any minor disappointment could lead to a contraction in prices.”
Again, this deviation is driven by the largest cap-weighted names. Still, there are also more extreme signs of speculative appetite currently flowing into the markets.
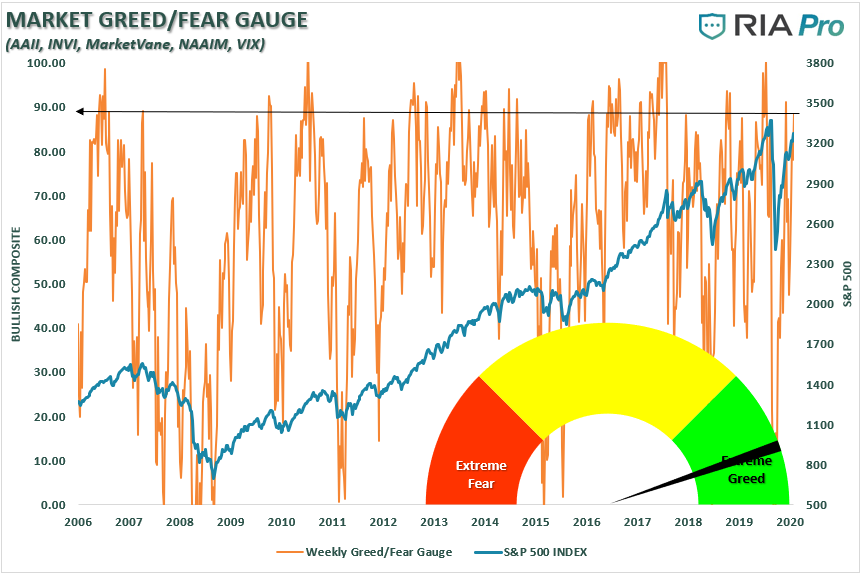
The Greed Factor
The RIAPro sentiment gauge, which is based on actual investor positioning, is at more extreme levels.
The put/call ratio is also at a historic low, which suggests that investors have given up hedging risk in portfolios entirely. I have marked the previous points where the put/call ratio was this imbalanced.
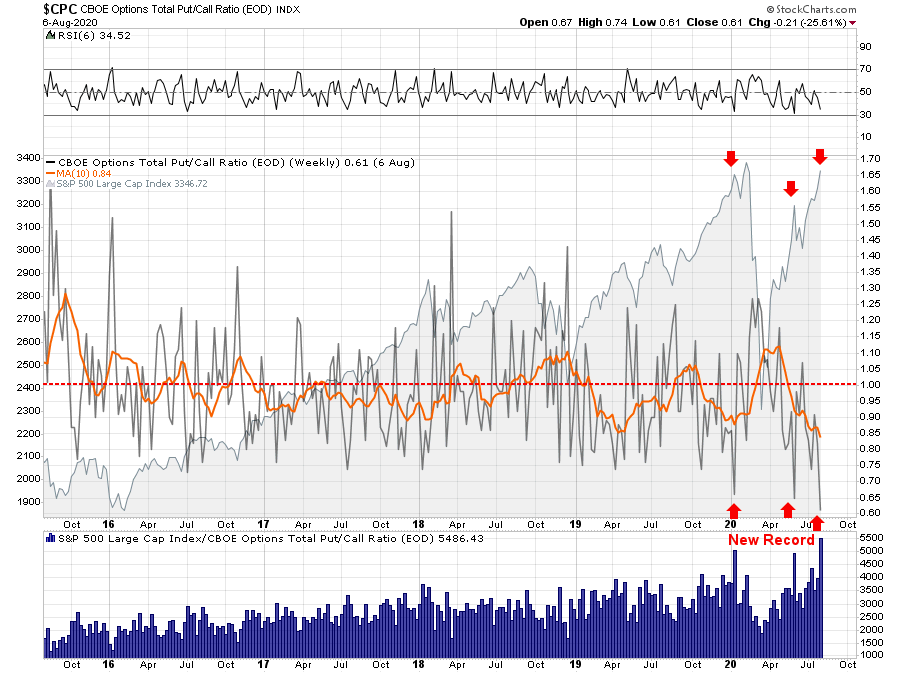
Importantly, this is all very “bullish” for now.
The point about these indicators, is that in the short-term (a few days to a few weeks) it suggests the markets will likely continue to rise. Such is because “momentum” is a tough thing to kill.
However, longer-term, they have a long history of suggesting increasing levels of risk, which eventually leads to less pleasant outcomes...
* * *
Read Full Story »»»
 DiscoverGold
By: Lance Roberts | August 8, 2020
Bulls Charge To All-Time Highs
As discussed previously in “Insanely Stupid,” we noted the market remained confined to its consolidation channel, but the bullish bias was to the upside.
“While the market has not been able to push above the recent July highs, support is holding at the rising bullish trend line. With the short-term ‘buy signals’ back in play, the bias at the moment is to the upside.
However, as we have discussed over the last couple of weeks, July held to its historical trends of strength. With a bulk of the S&P 500 earnings season behind us, we suspect the weakening economic data will begin to weigh sentiment in August and September.“

While weaker economic data has not yet dented the “bullish sentiment” at this juncture, it doesn’t mean it won’t. However, as we have discussed over the last several weeks, a breakout of the consolidation range, which was capped by the June highs, would put all-time highs into focus.
A Weighted Distortion
The concern is that what you see with the market, is not necessarily what you get. The chart below shows the number of stocks trading above the 200-dma versus the S&P 500 trading above its 200-dma.

In theory, if the “market” is above its 200-dma, then a large number of stocks, usually about 80%, should also be. However, such is not the case, as only 55% currently do so.
The market is currently being driven to new highs by the “chase” into the largest mega-capitalization stocks. Sentiment Trader noted this on Friday:
“The biggest stock in the U.S. and nearly the world, Apple, keeps powering higher. At the end of June, the value of Apple alone was nearly 80% of the Russell 2000 index’s market capitalization. As of today, it’s nearly 90%. This is astounding – in the past 40 years, no single stock has come close to dwarfing the value of so many other companies.“

By itself, this data point does not have a lot of historical relevance. However, it does tend to be more of an indication of underlying “exuberance” in the market.
The point here, however, is the top-5 stocks are distorting the overall market participation.
Let Me Explain The Math
Currently, the top-5 S&P stocks by market capitalization (AAPL, AMZN, GOOG, FB, and MSFT) make up the same amount of the S&P 500 as the bottom 394 stocks. Those same five also comprise 26% of the index alone.

What investors are missing is that the top-5 stocks are distorting the movements in the overall index.
For each $1 put into each of those top-5 stocks, the impact on the index is the same as putting $1 into each of the bottom 394 stocks. Such is clearly not a true representation of either the market or the economy.
As we have noted recently, if you own anything OTHER than those top-5 stocks, your portfolio is likely underperforming the market this year.
Exuberance Abounds
This past week, we discussed with our RIAPro Subscribers (Try Risk-Free for 30-days) the dangers of chasing markets, which have deviated extremely from their long-term means. The risk, of course, is that markets always, without exception, revert to the mean. The only question is the “timing” of the event.
Specifically, we noted the deviation of the Nasdaq from its 200-dma, which remains near a record high.
“Moving averages, especially longer-term ones, are like gravity. The further prices become deviated from long-term averages, the greater the ‘gravitational pull’ becomes. An ‘average’ requires prices to trade above and below the “average” level. The risk of a reversion grows with the size of the deviation.
The Nasdaq currently trades more than 23% above its 200-dma. The last time such a deviation existed was in February of this year. The Nasdaq also trades 3-standard deviations above the 200-dma, which is another extreme indication.
Such does not mean the market is about to crash. However, it does suggest the ‘rubber band’ is stretched so tightly any minor disappointment could lead to a contraction in prices.”

Again, this deviation is driven by the largest cap-weighted names. Still, there are also more extreme signs of speculative appetite currently flowing into the markets.
The Greed Factor
The RIAPro sentiment gauge, which is based on actual investor positioning, is at more extreme levels.

The put/call ratio is also at a historic low, which suggests that investors have given up hedging risk in portfolios entirely. I have marked the previous points where the put/call ratio was this imbalanced.

Importantly, this is all very “bullish” for now.
The point about these indicators, is that in the short-term (a few days to a few weeks) it suggests the markets will likely continue to rise. Such is because “momentum” is a tough thing to kill.
However, longer-term, they have a long history of suggesting increasing levels of risk, which eventually leads to less pleasant outcomes...
* * *
Read Full Story »»»
 DiscoverGold
Information posted to this board is not meant to suggest any specific action, but to point out the technical signs that can help our readers make their own specific decisions. Caveat emptor!
• DiscoverGold
Join the InvestorsHub Community
Register for free to join our community of investors and share your ideas. You will also get access to streaming quotes, interactive charts, trades, portfolio, live options flow and more tools.

