


| Followers | 689 |
| Posts | 143817 |
| Boards Moderated | 35 |
| Alias Born | 03/10/2004 |
Sunday, August 09, 2020 2:11:06 PM
The Aftermath of 2020: What Will It Look Like?
By: Tom Bowley | August 8, 2020
* (Click Read Full Story »»» at the bottom of the page for the charts to appear on the post)
Somehow, we've been able to weather the storm that's called 2020. I'm speaking from a stock market perspective. The health care crisis has taken its toll and continues to take its toll and impact our everyday lives. But if you pulled up an S&P 500 chart from the February all-time high and compared it to today, there hasn't been much change:
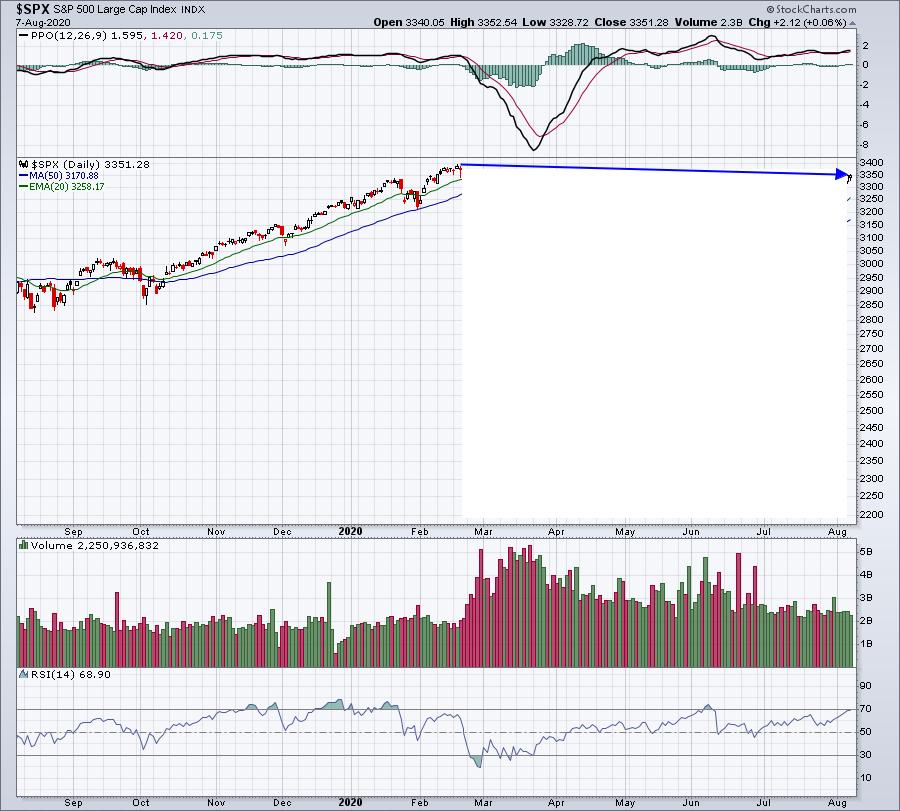
If we hadn't known what had happened and simply looked at the stock market in February and then fast-forwarded to the August 7th close, the above is what we would have seen. No problem, right? Well, we all know that the missing data created more than a few anxious moments. But honestly, in a secular bull market, those with a long-term mindset should literally just try to block out all the noise just as I've done on the chart above. Secular bull markets go higher and this is what I expect we'll be looking at over the next decade:
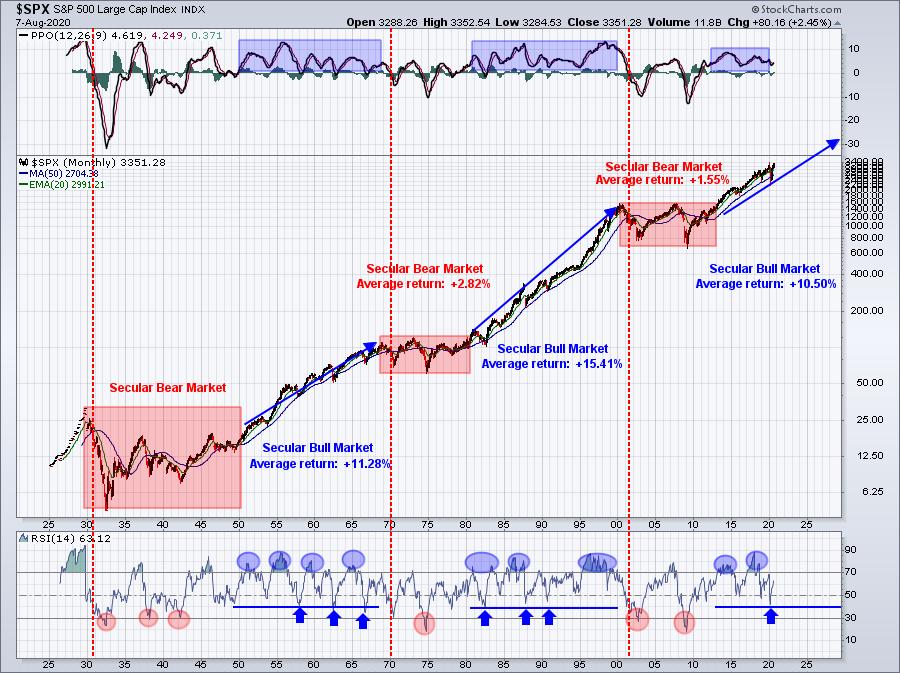
There are long-term characteristics to watch for in a secular bull market. First, the monthly PPO always remains positive. Why? Because cyclical bear markets do not last long enough historically to take the monthly PPO into negative territory. 2020 has followed this perfectly, as did the initial trade war issues in Q4 2018. Next, the monthly RSI typically moves well above RSI 70, but rarely dips below RSI 40. Finally, the red vertical dotted lines show the monthly PPO moving into negative territory. In each case in the last 100 years, this development started a secular bear market. Look at where we are now - well above the zero line and beginning to move higher again.
You can fight this bull market all you want, but you won't win - at least not in my opinion.
I also would like to mention that Monday, August 10, 2020 will mark the one year anniversary of my announcement, "I'm Returning To My Roots At EarningsBeats.com!". Many of you have taken quite a ride with me and our EarningsBeats.com team over the past year and I cannot thank you enough. Everyone at StockCharts.com has also been incredibly supportive of my decision. It's truly a blessing to do what I do. John Hopkins, his son Chris, and I have been together now for over 16 years and my return to EarningsBeats.com last year coincided with my daughter Erin (a fellow CPA) joining us. Now we have 2 CPAs that never met a spreadsheet we didn't like! In all seriousness, though, Erin provides us yet another level of analytical expertise that has powered our research area over the past year. If you're not familiar with what we do, I want you to mark your calendar for the following two events:
1. Top 10 Stock Selections - Sneak Preview, to be held on Monday, August 10th at 4:30pm ET
2. The Research Engine at EarningsBeats.com, to be held on Saturday, August 15th at 2:00pm ET
Both events are open to the public and entirely free. The first webinar, "Top 10 Stock Selections - Sneak Preview" delves into our design strategy for our 4 portfolios, including our flagship Model Portfolio, which boasts amazing inception-to-date results:
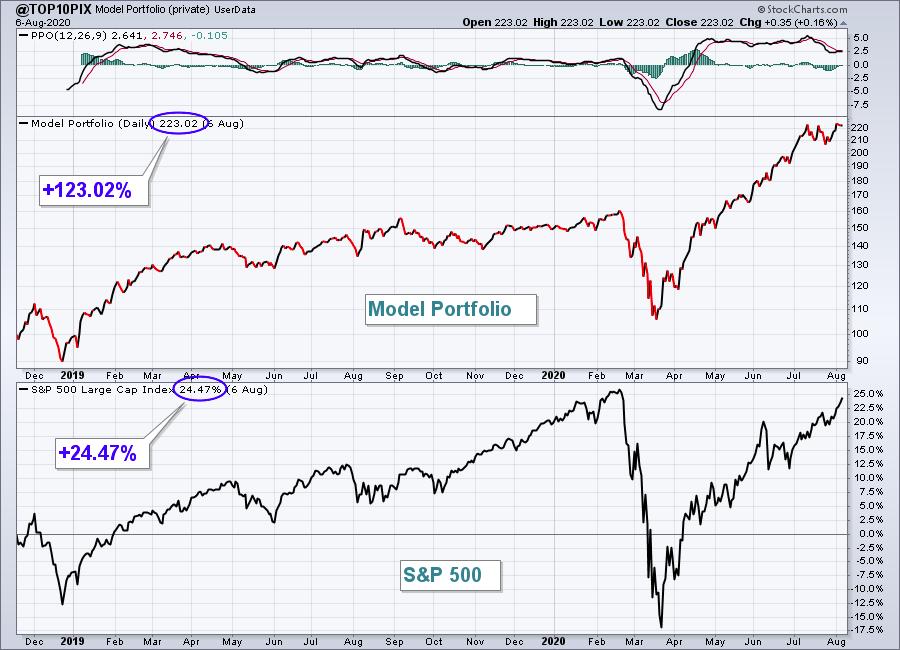
That's from November 19, 2018 through the Thursday, August 6th close. The selection process is all documented with webinar recordings verifying the stocks selected and the entry prices. Best of all, following this approach is SIMPLE. The Model Portfolio is comprised of 10 leading equal-weighted stocks in 10 leading industries. It's a strategy that buys these 10 stocks and holds them for 3 months. It's a "fundamental analysis meet technical analysis" strategy that's now beaten the S&P 500 in 5 of 6 quarters since its inception - and soon-to-be 6 of 7 quarters. On Monday, I'll discuss exactly the process I go through to select the 10 stocks for our Model Portfolio, as well as our other 3 portfolios - Aggressive, Income, and Strong AD (Accumulation/Distribution). We utilize our fundamental and technical expertise and combine it with the great tools right here at StockCharts.com. You won't want to miss this event. And did I mention it's FREE?
At the time I made my announcement that I was returning to EarningsBeats.com, our Model Portfolio had a value of 149.67. At Thursday's close it was 223.02. That represents a gain of 49.01% in the last year. The S&P 500, by comparison, moved from 2918.65 to 3349.16 (Thursday's close), for a gain of 14.75%. That's more than 33 percentage points difference in 12 months.
As I look ahead to the balance of 2020 and through 2021, I see a major opportunity. A strengthening global economy, exploding earnings growth, record low interest rates, Fed accommodation, government stimulus, and trillions of dollars of rotation from global bond markets to global stock markets will spur one of the greatest bull markets of our lifetime. For those that believe this market is toast, well you probably won't agree with what I have to say. But for the rest of you, I am on record saying that the S&P 500 will hit 10,000 and more than triple from its current level - during this decade. If I'm right, EarningsBeats.com will be the place to be.
Happy trading!
Tom
Read Full Story »»»
 DiscoverGold
Information posted to this board is not meant to suggest any specific action, but to point out the technical signs that can help our readers make their own specific decisions. Caveat emptor!
• DiscoverGold
Join the InvestorsHub Community
Register for free to join our community of investors and share your ideas. You will also get access to streaming quotes, interactive charts, trades, portfolio, live options flow and more tools.

