


| Followers | 689 |
| Posts | 143817 |
| Boards Moderated | 35 |
| Alias Born | 03/10/2004 |
Saturday, August 08, 2020 9:41:15 AM
CoT: Peek Into Future Through Futures, How Hedge Funds Are Positioned
By: Hedgopia | August 8, 2020
• Following futures positions of non-commercials are as of August 4, 2020.
E-mini S&P 500: Currently net short 44.8k, up 5.5k.
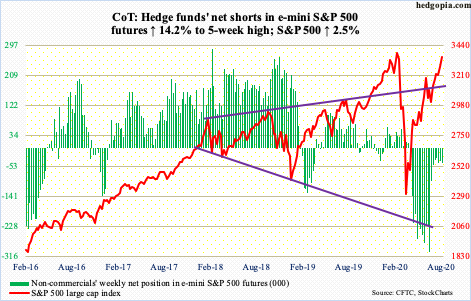
After defense of the 20-day seven sessions ago, the S&P 500 is up 4.6 percent! As unreal as it sounds, it is what it is. Volume meanwhile continues to be anemic. This divergence likely proves costly at some point, but right here and now price is what matters.
The index (3351.28) was up in all five sessions this week, rallying all long the now-rising daily upper Bollinger band. The gap from February 24 has been filled (more on this here). The February 19th all-time high of 3393.52 is 1.3 percent away – only a matter of time it is tested.
In less than six months, the S&P 500 has been through quite a roller-coaster ride. At the low on March 23, it tagged 2191.86. From that trough, it would have rallied 55 percent to test its February high. All this was made possible without much cooperation from flows. Between March 23 and Wednesday this week, SPY (SPDR S&P 500 ETF), VOO (Vanguard S&P 500 ETF) and IVV (iShares Core S&P 500 ETF) collectively lost $4.8 billion (courtesy of ETF.com), while US-based equity funds lost $86.5 billion (courtesy of Lipper).
Nasdaq 100 index (mini): Currently net long 18.3k, down 5.8k.

Last Friday’s potentially bearish hanging man was not confirmed. The Nasdaq 100 (11139.39) began the week with Monday’s gap-up, followed by positive sessions in the next three sessions, all along the daily upper Bollinger band – to Thursday’s new intraday high of 11282.24. Bulls now have carved out decent support at 11000, which was kind of tested Friday.
Flows were negative in the week to Wednesday, with QQQ (Invesco QQQ Trust) losing $487 million, but this obviously is just one variable. Among others, QQQ short interest remains elevated. Mid-July, it fell five percent period-over-period to 62.3 million, but the preceding period’s 65.6 million was a three-and-a-half-month high. Zealous shorts have consistently lent a helping hand to the longs.
Russell 2000 mini-index: Currently net long 7.6k, down 8k.
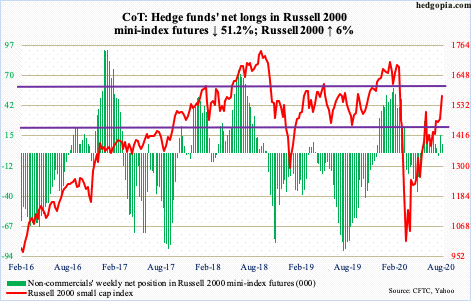
After pretty much hugging 1450s-60s for two weeks, the Russell 2000 (1569.18) decidedly pulled away this week. The June 8th high of 1537.62 has been eclipsed for a higher high. This should raise small-cap bulls’ hopes that a test of 1600-plus is in the cards. This level goes back to January 2018 and has proven crucial for bulls and bears alike.
Hopefully for bulls, this week’s action will help attract flows. At least in the week to Wednesday, $1.8 billion was redeemed from IWM (iShares Russell 2000 ETF), while IJR (iShares Core S&P Small-Cap ETF) took in $181 million (courtesy of ETF.com).
US Dollar Index: Currently net short 6.5k, down 252.
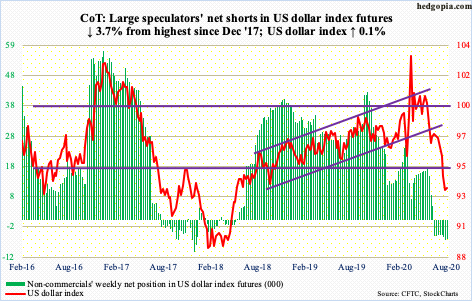
Monday’s rally attempt stopped at the 10-day, resulting in a shooting star session. The US dollar index (93.43) met with the same fate Tuesday. Come Friday, the average got taken out, albeit slightly.
From dollar bulls’ perspective, the good thing is that last Friday’s low of 92.52 held, with Thursday’s (this week) doji session breaching that low by 0.02. Horizontal support just north of 92 goes back at least 17 years.
Early last week, a rising trend line from May 2011, when the index bottomed at 72.70, was breached. Monday’s intraday high of 93.98 kissed the underside of that broken support. It needs watching. Otherwise, the index is primed for a relief rally – magnitude and duration notwithstanding. The weekly produced a long-legged doji this week.
Inability for the index to stabilize around here makes it vulnerable to a test of 88-89.
VIX: Currently net short 87.5k, down 1.4k.
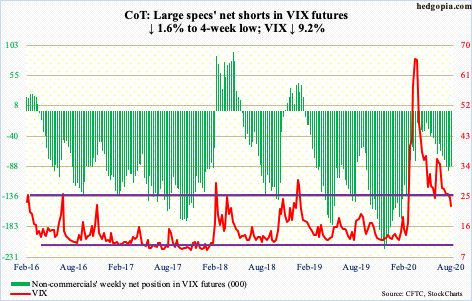
For the first time since February 24, VIX (22.21) traded with a 20 handle. Thursday’s intraday low of 20.97 also came in a spinning top session. Tuesday was a doji. For a month now, the index has pretty much been trading along the now-slightly-falling daily lower Bollinger band.
Volatility bulls better hope rally attempts going forward do not face resistance at mid-20s.
Once the volatility index reversed lower after peaking at 85.47 on March 18, several support levels gave way, which then consistently resisted rally attempts – 36-37 in June and 30-31 in July.
Read Full Story »»»
 DiscoverGold
Information posted to this board is not meant to suggest any specific action, but to point out the technical signs that can help our readers make their own specific decisions. Caveat emptor!
• DiscoverGold
Join the InvestorsHub Community
Register for free to join our community of investors and share your ideas. You will also get access to streaming quotes, interactive charts, trades, portfolio, live options flow and more tools.

