


| Followers | 689 |
| Posts | 143817 |
| Boards Moderated | 35 |
| Alias Born | 03/10/2004 |
Thursday, April 09, 2020 11:02:42 AM
By: Julius de Kempenaer | April 9, 2020
* (Click Read Full Story »»» at the bottom of the page for the charts to appear on the post)
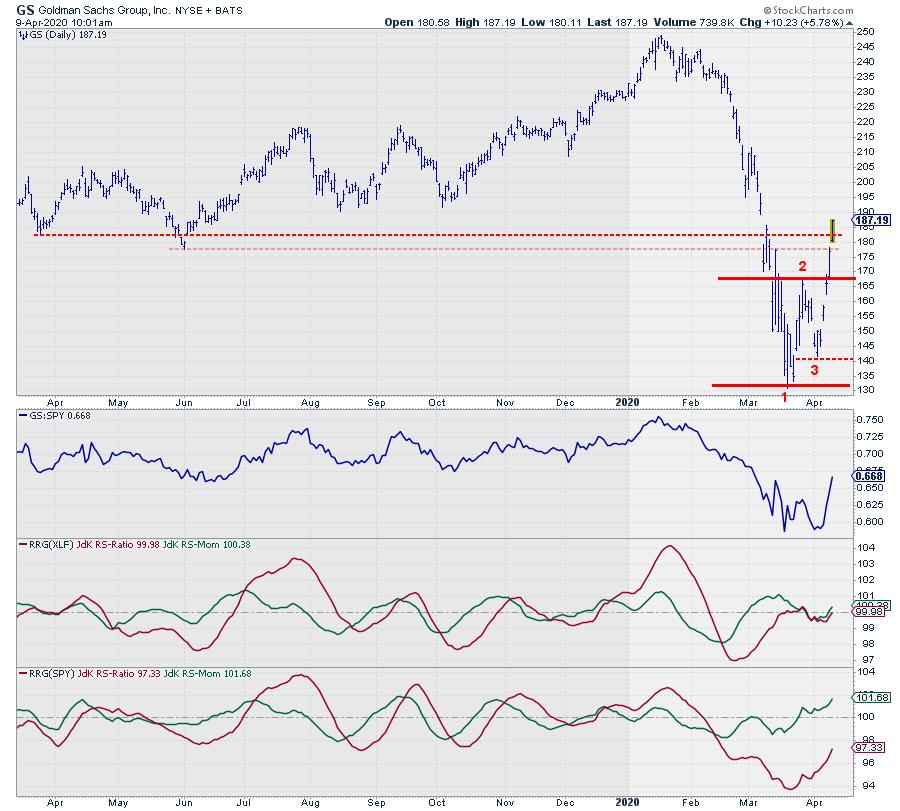
$248.94 ... That was the high for GS, set on Jan 17/2020. Two months later, on Mar 19/2020 a low was reached at $ 130.85. The stock almost halved... So now what?
On the (weekly) RRG for US sectors, Financials is travelling well inside the lagging quadrant and pushing further into it. The daily RRG shows XLF inside improving at flat RS-Momentum which makes it doubtful if the leading quadrant can be reached. In short, the Financials sector is not the best to invest in at the moment (pun intended).
Zooming in on the daily rotation for the individual members of the Financials sector against XLF, GS triggers the attention.

Over the last 20-30 trading days GS rotated from improving into leading but immediately rolled over and moved from leading straight into weakening, without touching the weakening quadrant. In there the tail stalled and remained static with the day-to-day observations clustered close together.
Since two days GS started to accelerate out of that cluster and is now hitting the leading quadrant again which suggests an outperformance going forward.
The price chart at the top of this article shows the daily bars for GS with relative strength against XLF and two panes with RRG-Lines. The first one shows the RRG-Lines vs XLF and the second pane shows the RRG-Lines vs SPY.
The RRG-Lines vs XLF correspond with the position of GS on the daily RRG printed above. The RRG-Lines vs SPY position GS inside the improving quadrant and travelling at a positive RRG-Heading but not yet inside the leading quadrant.
The most interesting part of the market structure since the low (1) was set is the fact that the second low (3) came in at a higher level than. This indicates that buyers came in more aggressively than on March 19. Breaking above the in-between high (2) with a follow through today, in the basis, signals that a new up-trend (higher highs and higher lows) is underway.
Obviously there is plenty of resistance, coming from former lows, on the way up but the worst seems to be over, at least for the time being.
For short-term traders this could be a nice setup, especially when price dips back into the $ 170-175 support zone. Another option would be to hedge a long position in GS with a short in XLF or SPY to mitigate sector or market risk.
#Staysafe
--Julius
Read Full Story »»»
 DiscoverGold
Information posted to this board is not meant to suggest any specific action, but to point out the technical signs that can help our readers make their own specific decisions. Caveat emptor!
• DiscoverGold
Recent GS News
- OpenAI Unveils Strawberry AI Model Series; Boeing Stock Falls 4% Amid Strike; HR Surges 20% on Growth Forecast • IH Market News • 09/13/2024 10:12:55 AM
- Norfolk Southern CEO Fired, Ryanair Lowers Fare Forecast, 23andMe Considers Acquisition Proposals • IH Market News • 09/12/2024 10:02:29 AM
- GameStop plunges 11% on stock offering, DJT drops post-debate, GSK fails shingles vaccine trial • IH Market News • 09/11/2024 10:25:41 AM
- Goldman Sachs Custody Solutions and NewEdge Capital Group Announce Strategic Collaboration to Provide Enhanced Services to RIAs • GlobeNewswire Inc. • 09/10/2024 01:00:00 PM
- Apple Loses EU Dispute; Google’s $2.7 Billion Fine Upheld; Oracle Shares Surge 9% • IH Market News • 09/10/2024 10:02:31 AM
- Dell, Palantir, and Erie Will Be Added to the S&P 500; Boeing Avoids Strike; Apple Event Takes Place Today • IH Market News • 09/09/2024 10:05:35 AM
- Broadcom Down 10% Post-Earnings, UiPath Up 8%; Qualcomm Eyes Intel Assets; Salesforce Acquires Own Company • IH Market News • 09/06/2024 11:59:00 AM
- Qualcomm Develops Mixed Reality Glasses; Verizon to Boost Dividend, Eyes Acquisition; Samsonite Plans US Dual Listing • IH Market News • 09/05/2024 10:11:35 AM
- Nvidia Subpoenaed by DOJ, Athira Pharma Shares Plunge 71% After Study Fails, Zscaler Falls 15% Post-Earnings • IH Market News • 09/04/2024 09:50:25 AM
- Apple Names New CFO, Sony Hikes PS5 Price in Japan, Santander Launches Share Buyback • IH Market News • 08/27/2024 09:35:22 AM
- Berkshire Reduces Stake in BofA, Hawaiian Airlines Soars 10%, Paramount Receives $4.3B Offer, and More • IH Market News • 08/20/2024 09:56:02 AM
- FuboTV Soars 12% After Venu Sports Block, Goldman Sachs Lowers U.S. Recession Odds, BHP Ends Chile Strike • IH Market News • 08/19/2024 09:28:19 AM
- Bitcoin Fall Hits Other Tokens, MicroStrategy Launches Leveraged ETF, Mintzberg Takes Over Grayscale Leadership • IH Market News • 08/15/2024 07:35:02 PM
- Google Mandated to Modify Play Store, Apple Innovates, Victoria’s Secret Hires CEO, Mars Buys Kellanova • IH Market News • 08/15/2024 10:05:46 AM
- Google Forced to Modify Play Store, Apple Innovates, Victoria’s Secret Hires CEO, Mars Buys Kellanova • IH Market News • 08/15/2024 10:05:46 AM
- AI Energy Use Overtakes Bitcoin, BTC Price Falls, Goldman Sachs Puts $418M in Bitcoin ETFs, and Latest in Crypto • IH Market News • 08/14/2024 07:26:36 PM
- Dell Stock Slide Offers Opportunities; Trump and Musk hold talks on X; GM Restructures China Operations, and More • IH Market News • 08/13/2024 09:43:49 AM
- US Index Futures Rise Amid Earnings Season Optimism, Oil Prices Rebound • IH Market News • 08/07/2024 09:49:12 AM
- Joby Aviation Seeks Australian Certification, Arcadium Lithium Projects Suspended Due to Oversupply, and More • IH Market News • 08/07/2024 09:47:32 AM
- Goldman Sachs Alternatives Makes $440 Million Strategic Investment in BrightNight to Fund Continued Growth • PR Newswire (US) • 08/01/2024 11:00:00 AM
- Virtú Investments Acquires Iconic Skyglass Tower in Downtown Seattle • GlobeNewswire Inc. • 08/01/2024 01:00:29 AM
- Upbeat Earnings News May Spark Early Rally On Wall Street • IH Market News • 07/31/2024 01:07:54 PM
- ASML Rises 7% on Export Waiver; Intel Plans Layoffs, HSBC $3B Buyback Announced, and More • IH Market News • 07/31/2024 09:55:50 AM
- osapiens raises $120 million funding round led by Growth Equity at Goldman Sachs Alternatives • Business Wire • 07/29/2024 12:00:00 PM
- Alphabet Unveils AlphaProof and AlphaGeometry 2; OpenAI Tests SearchGPT; Apple Loses Market Share in China • IH Market News • 07/26/2024 10:07:41 AM
North Bay Resources Announces Mt. Vernon Gold Mine Bulk Sample, Sierra County, California • NBRI • Sep 11, 2024 9:15 AM
One World Products Issues Shareholder Update Letter • OWPC • Sep 11, 2024 7:27 AM
Kona Gold Beverage Inc. Reports $1.225 Million in Revenue and $133,000 Net Profit for the Quarter • KGKG • Sep 10, 2024 1:30 PM
Element79 Gold Corp Announces 2024 Clover Work Plans & Nevada Portfolio Updates • ELMGF • Sep 10, 2024 11:00 AM
Nightfood Holdings Inc. Completes Major Step on Uplist Journey by Closing Strategic All-Stock Acquisition of CarryoutSupplies.com • NGTF • Sep 10, 2024 8:15 AM
Element79 Gold Corp. Announces Sale of 100% Interest in Elder Creek, North Mill Creek, and Elephant Projects to 1472886 B.C. Ltd. • ELEM • Sep 9, 2024 9:34 AM

