


Thursday, April 02, 2020 1:08:55 PM
Gold COMEX (Jun'20)
Gold COMEX (Jun'20) (@GC.1:CEC:Commodities Exchange Centre)
1,638.60 +47.20 (+2.9659%)
One MILLION Infected Tomorrow and over 50,000 DEAD Today All thanks to CHINA!!!!!!!!!!!!!!!
One MILLION Infected Tomorrow
Half of Planet Earth is now under orders by their Government to Shelter in Place. Corona has basically TURNED OFF the Global Economy and it could happen at a worse time with Global Debt to Global GDP at a Historic HIGH of 340%. Before the END of April Markets are going to Realize that the Global Economy will not just TURN itself back on when ""Big Government"" sounds the ALL Clear. For the S&P, The Drop in Q2 Earnings will seal an additional Drop of at least another 500 Points. Q1 Earnings reports about 2 weeks out just as Corona will be hitting PEAK Numbers in America............THERE IS More Market PAIN Coming for the ""PIMPS"" of Wall Street!!!!!!!!!!!
Markets Now At Tipping Point
Markets Now At Tipping Point
by Michael Markowski
RealInvestmentadvice.com
The market indices of the US, Japan, South Korea, Canada, France and Germany and the share prices for many of the world’s largest companies including Apple and Microsoft are at the tipping point. Stocks and indices reached their post-crash and relief rally closing highs from March 25th through March 27th.
None of the indices for the six countries has since closed above their highs. Since making their relief rally highs all eight of the indices have declined by 4.2% to 7.4%.

With each new passing day that the indices are unable to get new post-crash highs, the probability increases that they will careen back to and through their March 2020 lows.
Investors now need to make a decision; stay in the roller coaster or get out?
From my empirical research on the prior notable market crashes in early March 2020, I discovered that the 1929 crash and the bursting of the NASDAQ dotcom bubble in 2000 share the same genealogy as the crashes of the markets of the six countries which have been underway. The discovery was significant. It enabled the events chronology throughout the lives of the 1929 and 2000 crashes to be utilized to forecast the events for the crashes of six countries which are now underway and future crashes. For more about the genealogy read 03/23/20 “Probability 87% that market is at interim bottom” article.
The table below contains the first four precisely accurate forecasts that were made from the statistical crash probability analysis’ (SCPA). The SCPA was developed from the findings from my empirical research of the most notable market crashes since 1929.
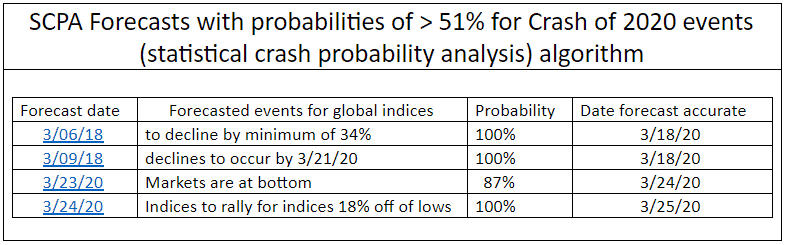
The charts below depict the almost identical chronology for the post-crash events that occurred after the Dow Jones crashed in 1929 and the NASDAQ dotcom bubble burst in 2000. The journey to the final bottom took the Dow 32 months and the NASDAQ 31 months. The NASDAQ declined by 78% and the Dow by 89% from their highs.
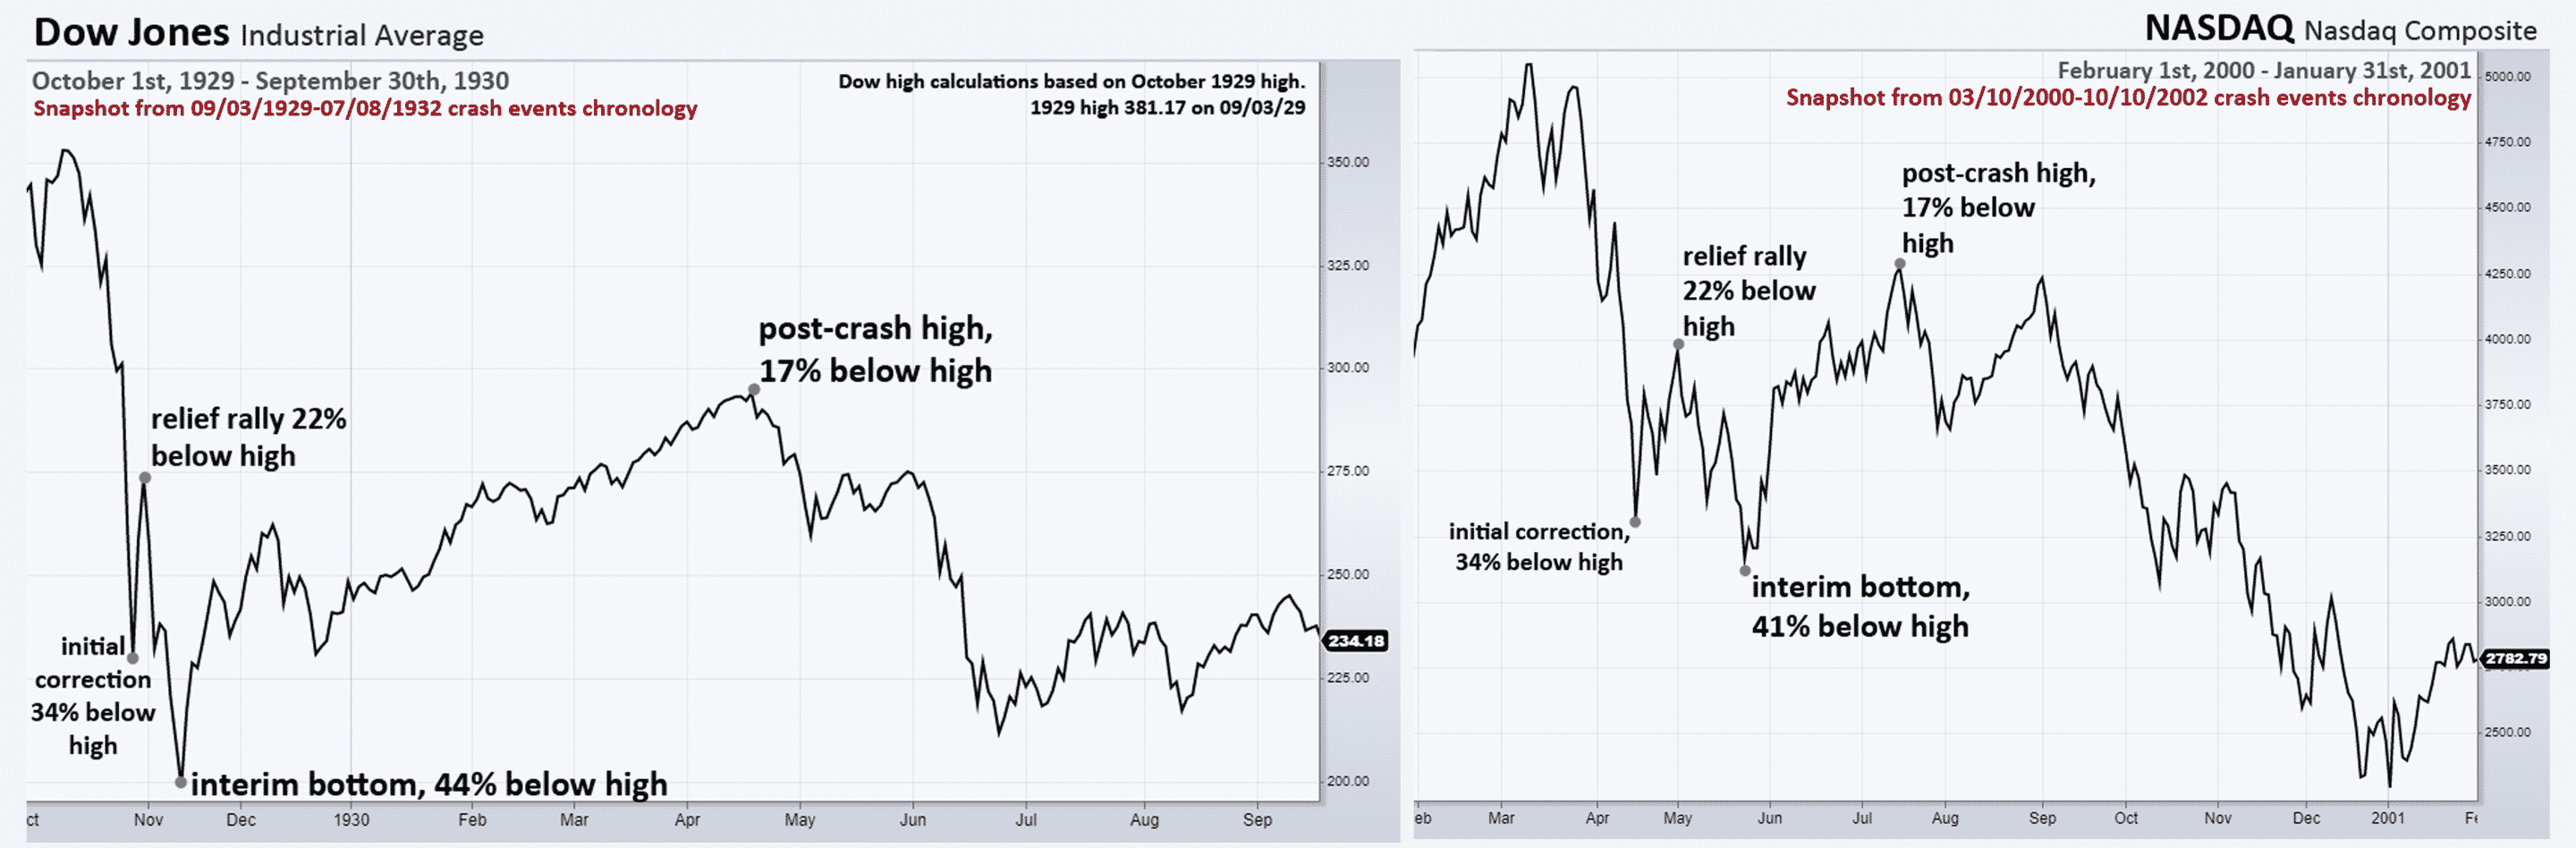
The “2020”, year to date charts of the US’ Dow Jones, S&P 500 and NASDAQ indices below depict their crash chronologies from February 20th through March 27th. Again, the chronologies of the 2020 crashes and the 1929 Dow and 2000 NASDAQ crashes though their initial correction and relief rally periods are very similar.

It was no surprise that the chart patterns for Microsoft and Apple mimic the three US indices. The two companies are the largest members of all three. Since they have significant index weightings, wherever the indices go, they will follow.

The above charts and tables provide the rationale as to why the eight indices of the six countries will soon begin their marches to the following in sequence:
cont....................
US Auto Sales Plunge To Lowest In A Decade
US Auto Sales Plunge To Lowest In A Decade, But The Worst Is Yet To Come In Q2
by Tyler Durden ZeroHedge
As we predicted in a a report we published just days ago, the U.S. auto industry is on the verge of total collapse. Numbers out of major automakers on Wednesday this week confirmed a worst case scenario: that the global pandemic is doing severe (and potentially irreversible) damage to an industry that was in ugly shape even before the coronavirus outbreak began.
GM saw sales plunge 7.1% and Fiat saw sales drop 10% for the first quarter of 2020, both larger than expected declines, according to Bloomberg. It's also worth noting that the industry didn't quite grind to a halt until March, and so Q2 numbers could wind up being far worse.
Toyota's sales fell 37% in March, with even its best-selling RAV4 dropping 25%. Nissan had the weakest quarterly results, posting a 30% drop in sales for the first three months of the year. More than 25% of Nissan's dealers are being negatively affected by state ordinances limiting sales.

David Kershaw, division vice president of the Nissan brand in North America, said: “We obviously saw quite a big tail-off in business. We’re feeling it in arguably one of our best regions, which is the northeast. They are obviously significantly impacted.”
Names like Volkswagen, Honda, Hyundai and Mazda all saw drops of over 40% for March. If automakers that report quarterly continue to follow this trend, Q2 numbers may be a sight to behold.
The things that were barely holding the industry up to start 2020, namely low rates and modest consumer confidence, don't matter. Businesses are closed, would-be buyers are strapped for cash and the country's economy has simply been turned off.
The industry's annualized selling rate has slowed to just 11.4 million, marking its lowest point since April 2010.
Recall, just 2 days ago we highlighted predictions that the SAAR could continue to plummet to between 9 million and 10 million vehicles. Those numbers are well below the 10.4 million autos sold in 2009, the year GM and Chrysler both filed for bankruptcy. J.P. Morgan has an even more pessimistic view, with estimates of a pace of 6 million to 7 million vehicles over the next month.
cont..................
Subprime Auto Loans Explode
Subprime Auto Loans Explode, “Serious Delinquencies” Spike to Record. But There’s No Jobs Crisis, These Are the Good Times
by Wolf Richter
Nearly a quarter of all subprime auto loans are 90+ days delinquent. Why?
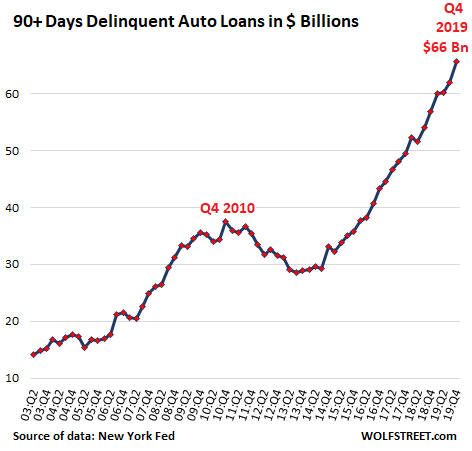
Auto loan and lease balances have surged to a new record of $1.33 trillion. Delinquencies of auto loans to borrowers with prime credit rates hover near historic lows. But subprime loans (borrowers with a credit score below 620) are exploding at a breath-taking rate, and they’re driving up the overall delinquency rates to Financial Crisis levels. Yet, these are the good times, and there is no employment crisis where millions of people have lost their jobs.
All combined, prime and subprime auto-loan delinquencies that are 90 days or more past due – “serious” delinquencies – in the fourth quarter 2019, surged by 15.5% from a year ago to a breath-taking historic high of $66 billion, according to data from the New York Fed released today:
Loan delinquencies are a flow. Fresh delinquencies that hit lenders go into the 30-day basket, then a month later into the 60-day basket, and then into the 90-day basket, and as they move from one stage to the next, more delinquencies come in behind them. When the delinquency cannot be cured, lenders hire a company to repossess the vehicle. Finding the vehicle is generally a breeze with modern technology. The vehicle is then sold at auction, a fluid and routine process.
cont...........
Recent GORO News
- Form 4 - Statement of changes in beneficial ownership of securities • Edgar (US Regulatory) • 05/06/2024 07:21:04 PM
- Form 4 - Statement of changes in beneficial ownership of securities • Edgar (US Regulatory) • 05/06/2024 07:19:30 PM
- Form 4 - Statement of changes in beneficial ownership of securities • Edgar (US Regulatory) • 05/06/2024 07:16:38 PM
- Gold Resource Corporation Reports Financial Results for the First Quarter 2024 • Business Wire • 05/02/2024 11:00:00 PM
- Gold Resource Corporation Will Reschedule Release of Its First Quarter 2024 Results • Business Wire • 04/30/2024 12:16:00 AM
- Gold Resource Corporation Announces Preliminary First Quarter Production Results • Business Wire • 04/16/2024 01:02:00 AM
- Gold Resource Corporation Reports Results of Operations for the Year Ended December 31, 2023 • Business Wire • 03/13/2024 08:59:00 PM
- Gold Resource Corporation Announces Preliminary Fourth Quarter and Year-End Results • Business Wire • 01/30/2024 05:15:00 PM
- Form 4 - Statement of changes in beneficial ownership of securities • Edgar (US Regulatory) • 01/10/2024 10:46:55 PM
- Gold Resource Corporation Reports High Grade Drill Results at the Don David Gold Mine • Business Wire • 12/11/2023 11:37:00 PM
- Form 8-K - Current report • Edgar (US Regulatory) • 11/07/2023 02:42:24 AM
- Gold Resource Corporation Reports Third Quarter Operational Results and Announces the Initiation of a Review to Evaluate Strategic Alternatives • Business Wire • 11/07/2023 02:22:00 AM
- Gold Resource Corporation Will Reschedule Release of Its Third Quarter 2023 Results • Business Wire • 11/03/2023 01:48:00 AM
- Gold Resource Corporation Reports the Filing of a SK1300 Initial Assessment for the Back Forty Project • Business Wire • 10/26/2023 10:31:00 PM
- Gold Resource Corporation Announces Q3 2023 Conference Call • Business Wire • 10/23/2023 07:35:00 PM
- Form 4 - Statement of changes in beneficial ownership of securities • Edgar (US Regulatory) • 10/20/2023 10:01:30 AM
- Gold Resource Corporation Announces Preliminary Third Quarter Results • Business Wire • 10/16/2023 10:34:00 PM
- Gold Resource Corporation Reports Continued Positive Drill Results at Don David Gold Mine • Business Wire • 09/12/2023 10:16:00 PM
- Form 3 - Initial statement of beneficial ownership of securities • Edgar (US Regulatory) • 08/10/2023 03:15:54 PM
- Change in Chief Financial Officer and the Appointment of Chet Holyoak As Interim Chief Financial Officer • Business Wire • 08/02/2023 10:45:00 PM
- Form 8-K - Current report • Edgar (US Regulatory) • 08/02/2023 09:00:11 PM
- Gold Resource Corporation Reports Mid-Year Operational Results • Business Wire • 07/26/2023 08:55:00 PM
- Form 8-K - Current report • Edgar (US Regulatory) • 07/26/2023 08:49:33 PM
- Form 10-Q - Quarterly report [Sections 13 or 15(d)] • Edgar (US Regulatory) • 07/26/2023 08:40:17 PM
- Gold Resource Corporation Announces Year-to-Date Production Results, Reaffirms 2023 Production Guidance • Business Wire • 07/13/2023 10:24:00 PM
VAYK Discloses Strategic Conversation on Potential Acquisition of $4 Million Home Service Business • VAYK • May 9, 2024 9:00 AM
Bantec's Howco Awarded $4.19 Million Dollar U.S. Department of Defense Contract • BANT • May 8, 2024 10:00 AM
Element79 Gold Corp Successfully Closes Maverick Springs Option Agreement • ELEM • May 8, 2024 9:05 AM
Kona Gold Beverages, Inc. Achieves April Revenues Exceeding $586,000 • KGKG • May 8, 2024 8:30 AM
Epazz plans to spin off Galaxy Batteries Inc. • EPAZ • May 8, 2024 7:05 AM
Moon Equity Holdings, Corp. Announces Acquisition of Wikolo, Inc. • MONI • May 7, 2024 9:48 AM

