


| Followers | 0 |
| Posts | 148553 |
| Boards Moderated | 7 |
| Alias Born | 03/10/2004 |
Friday, March 06, 2020 4:22:38 PM
Facebook Is in Make or Break Mode - Here’s How to Trade It
By: TheStreet | March 6, 2020
• The next few trading sessions will dictate Facebook's trajectory.
Facebook (FB) is under pressure in 2020.
The coronavirus is weighing on shares and Needham cut revenue and earnings estimates on fears that consumer spending slowdowns could impact ad sales. (And this week a contractor at Facebook’s Seattle Stadium East office tested positive for the virus).
Then there’s the political.
With the presidential election drawing near, Facebook has been under fire from both sides of the political aisle for its election ads - and its role in policing them.
All of that has impacted its stock price: Facebook is down nearly 12% since the calendar flipped to January, underperforming the rest of the broad market by a big margin.
But that’s only part of the story.
From a technical standpoint, Facebook’s sitting in make-or-break mode this month. That means shares could either be setting up for a solid buying opportunity - or another drop. To figure out which it is, we’ll turn to the chart.
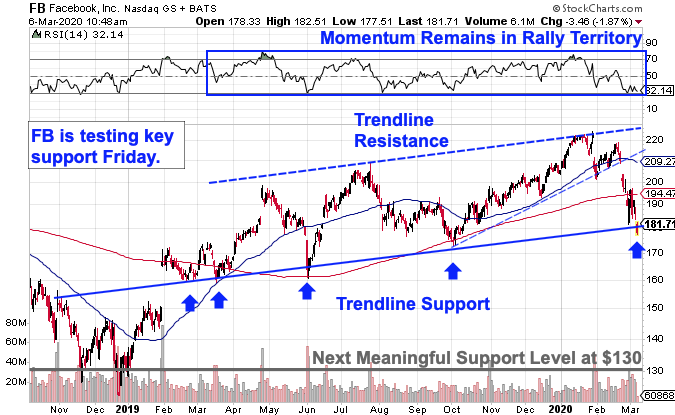
While Facebook kicked off 2020 on a solid note, in an uptrend that stretched back to October, that rally ended in February when shares closed below $205 for the first time. That, in turn, opened up about 12% downside risk as shares retraced down to longer-term support at the $180 level.
That’s the bad news. The good news is that, despite the selling, Facebook’s price action has actually been extremely technically obedient. Now, as shares test support for a longer-term (albeit shallower) uptrend that stretches back more than a year, investors could be eyeing a buying opportunity similar to the ones seen most recently last October and last June.
Shares are effectively sitting right on trendline support in Friday's session, teetering on the edge of a breakdown through $180 - but they’re quite not there yet. Facebook can temporarily dip below $180 without actually triggering the end of the trend; what investors should be mindful of is a material breach of that level.
It pays to wait and be reactionary with this trade. A bounce here at support early next week looks like a solid buying opportunity. That tells us that there’s still a glut of demand for shares at this historically key trendline. On the flipside, if Facebook does violate support, then the next meaningful price floor for shares is last January’s lows at $130.
Meanwhile, the edge still goes slightly to the bulls. Momentum, measured by 14-day RSI on the chart above, continues to hold its own lows over the course of the rally, signaling that the correction Facebook has experienced doesn’t look like a crash - at least not yet.
The next few trading sessions should be telling about Facebook’s trajectory over the course of the next couple of months. If (and only if) buyers assert themselves here, it’s an ideal time to be a buyer.
Read Full Story »»»
 DiscoverGold
Information posted to this board is not meant to suggest any specific action, but to point out the technical signs that can help our readers make their own specific decisions. Caveat emptor!
• DiscoverGold
Recent META News
- Form 4 - Statement of changes in beneficial ownership of securities • Edgar (US Regulatory) • 05/29/2026 10:51:23 PM
- Form 8-K - Current report • Edgar (US Regulatory) • 05/29/2026 08:16:13 PM
- Form 4 - Statement of changes in beneficial ownership of securities • Edgar (US Regulatory) • 05/28/2026 10:49:12 PM
- Meta Announces Quarterly Cash Dividend • PR Newswire (US) • 05/28/2026 09:56:00 PM
- Form 144 - Report of proposed sale of securities • Edgar (US Regulatory) • 05/27/2026 08:03:45 PM
- Form 144 - Report of proposed sale of securities • Edgar (US Regulatory) • 05/26/2026 08:06:21 PM
- SpaceX IPO targets retail investors as hype builds around record-breaking debut • IH Market News • 05/26/2026 02:01:53 PM
- Form SD - Specialized disclosure report • Edgar (US Regulatory) • 05/22/2026 08:10:54 PM
- Meta proposes limited free WhatsApp access for rival AI chatbots in Europe (META) • IH Market News • 05/20/2026 10:31:53 AM
- EssilorLuxottica shares retreat as Google and Samsung step up competition in AI glasses market • UK Market News • 05/20/2026 09:17:08 AM
- Form 4 - Statement of changes in beneficial ownership of securities • Edgar (US Regulatory) • 05/20/2026 12:58:24 AM
- Form 4 - Statement of changes in beneficial ownership of securities • Edgar (US Regulatory) • 05/20/2026 12:55:35 AM
- Form 4 - Statement of changes in beneficial ownership of securities • Edgar (US Regulatory) • 05/20/2026 12:53:10 AM
- Form 4 - Statement of changes in beneficial ownership of securities • Edgar (US Regulatory) • 05/20/2026 12:52:13 AM
- Form 4 - Statement of changes in beneficial ownership of securities • Edgar (US Regulatory) • 05/20/2026 12:52:08 AM
- Form 4 - Statement of changes in beneficial ownership of securities • Edgar (US Regulatory) • 05/20/2026 12:51:39 AM
- Form 4 - Statement of changes in beneficial ownership of securities • Edgar (US Regulatory) • 05/20/2026 12:49:59 AM
- Form 4 - Statement of changes in beneficial ownership of securities • Edgar (US Regulatory) • 05/20/2026 12:31:07 AM
- Form 4 - Statement of changes in beneficial ownership of securities • Edgar (US Regulatory) • 05/20/2026 12:27:05 AM
- Form 4 - Statement of changes in beneficial ownership of securities • Edgar (US Regulatory) • 05/20/2026 12:24:36 AM
- Form 4 - Statement of changes in beneficial ownership of securities • Edgar (US Regulatory) • 05/20/2026 12:19:16 AM
- Form 4 - Statement of changes in beneficial ownership of securities • Edgar (US Regulatory) • 05/20/2026 12:17:16 AM
- Form 4 - Statement of changes in beneficial ownership of securities • Edgar (US Regulatory) • 05/20/2026 12:08:09 AM
- Form 4 - Statement of changes in beneficial ownership of securities • Edgar (US Regulatory) • 05/20/2026 12:06:22 AM
- Form 4 - Statement of changes in beneficial ownership of securities • Edgar (US Regulatory) • 05/20/2026 12:04:13 AM


