


Thursday, February 20, 2020 5:57:42 AM
ACTL - PFMS - Comparison Analysis
I'll Alert you of stocks to Buy,
before the Run happens !

_____________________________________________________________
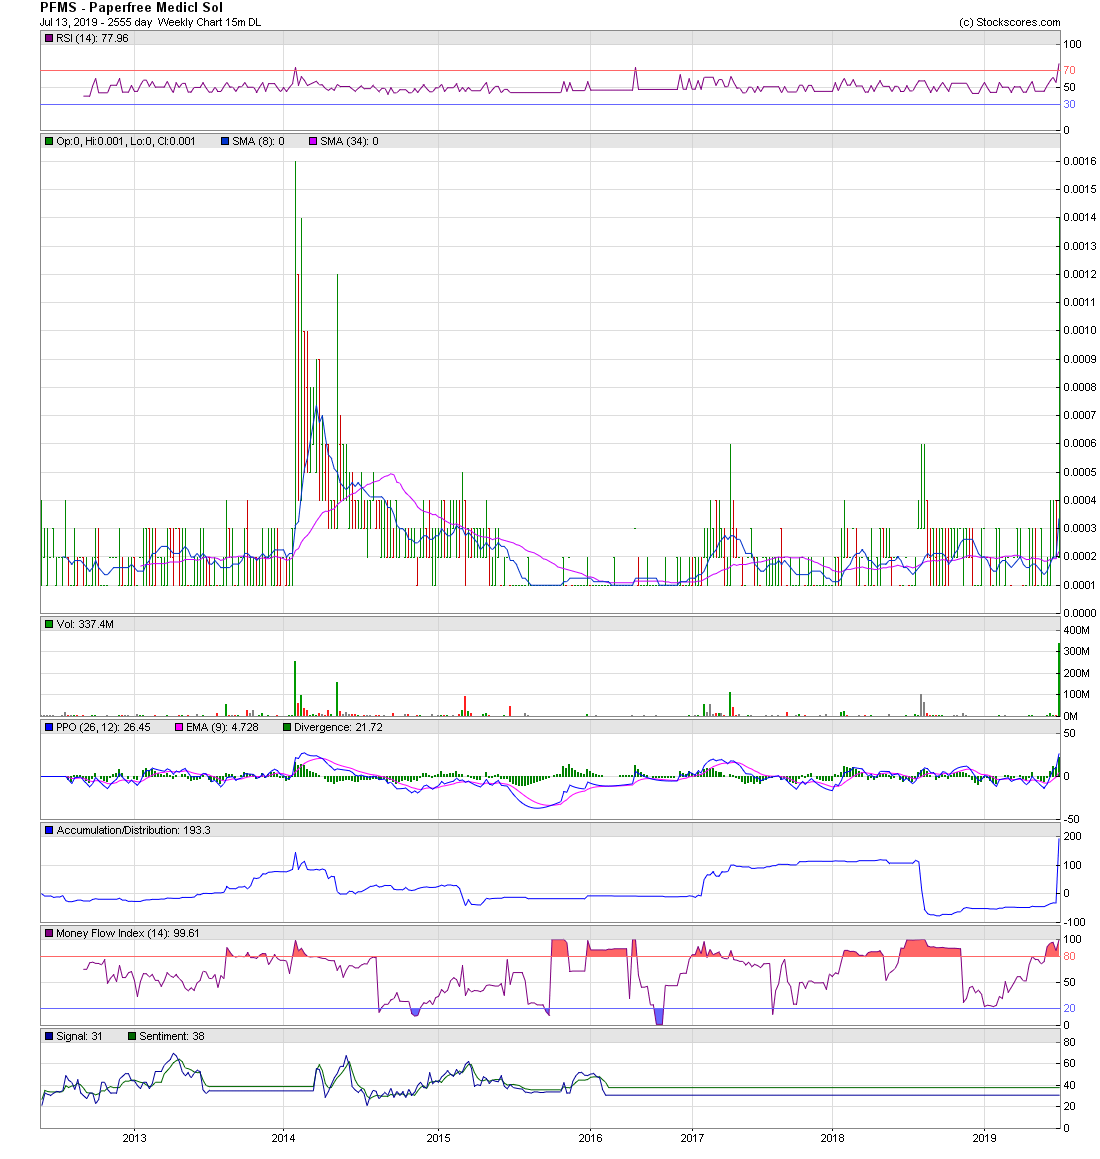
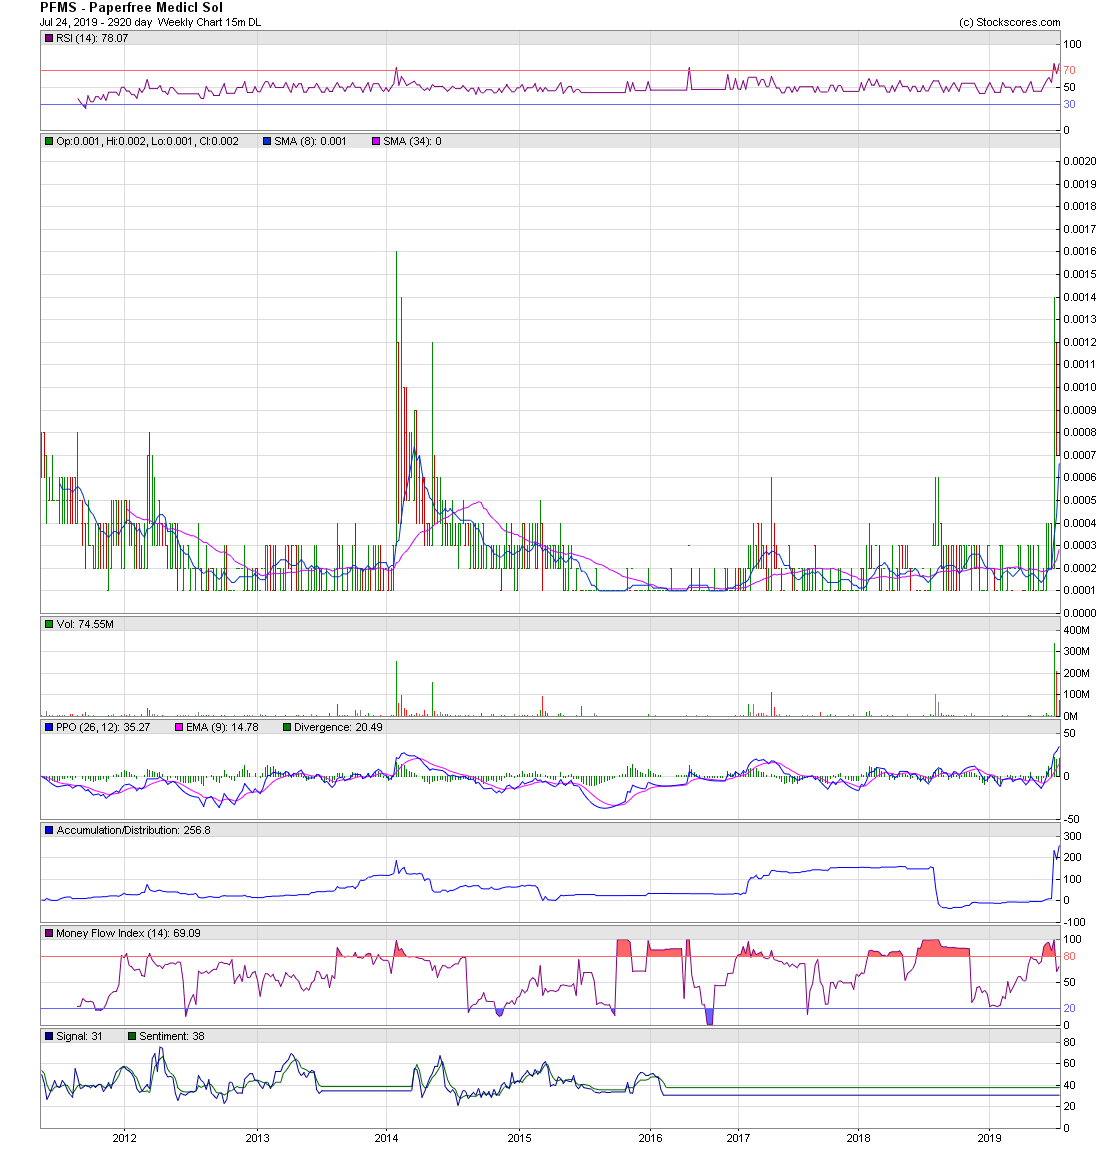
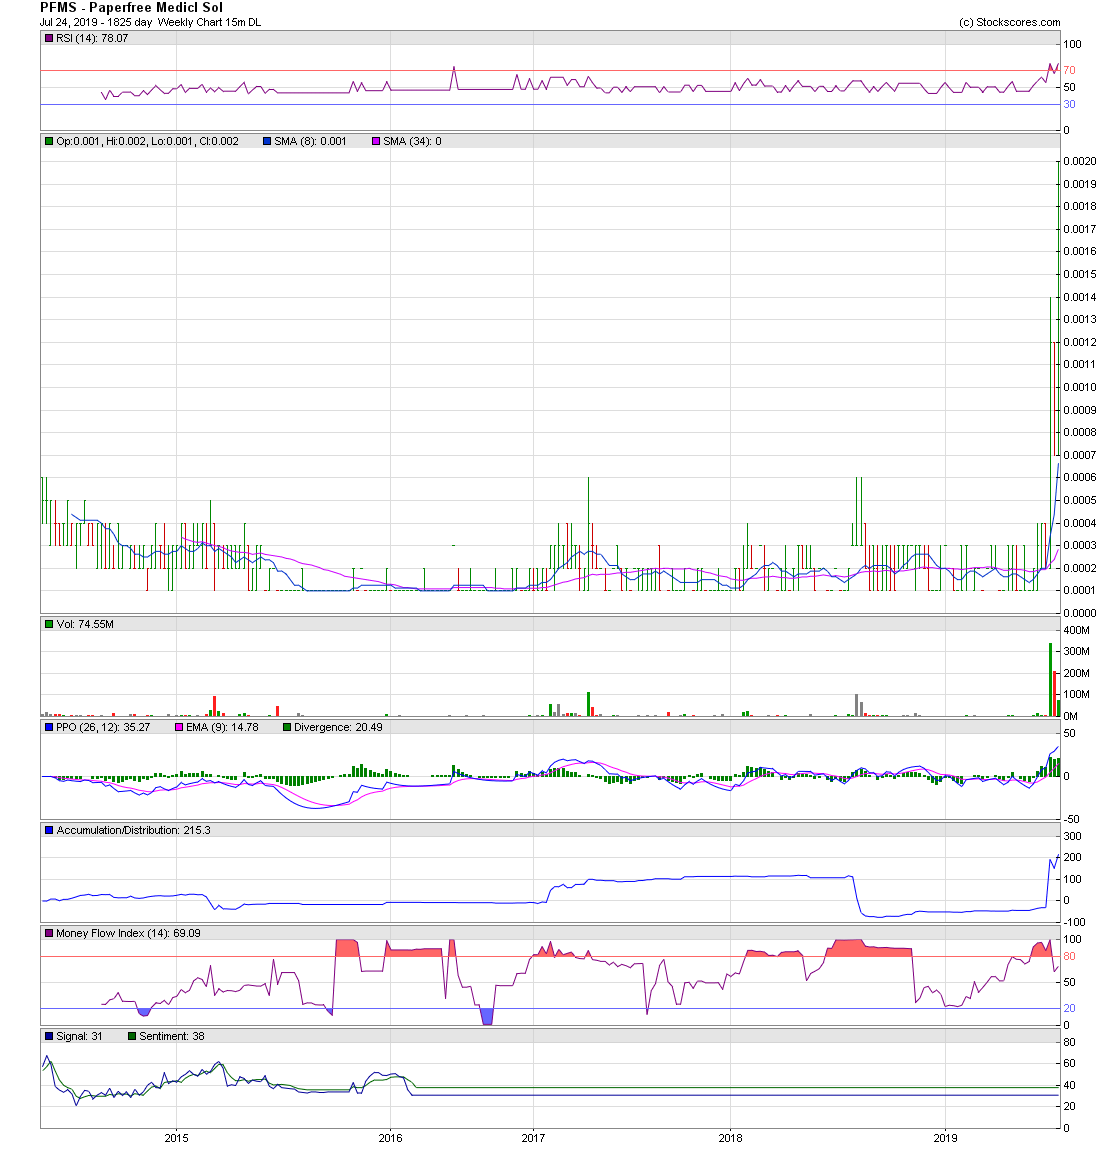
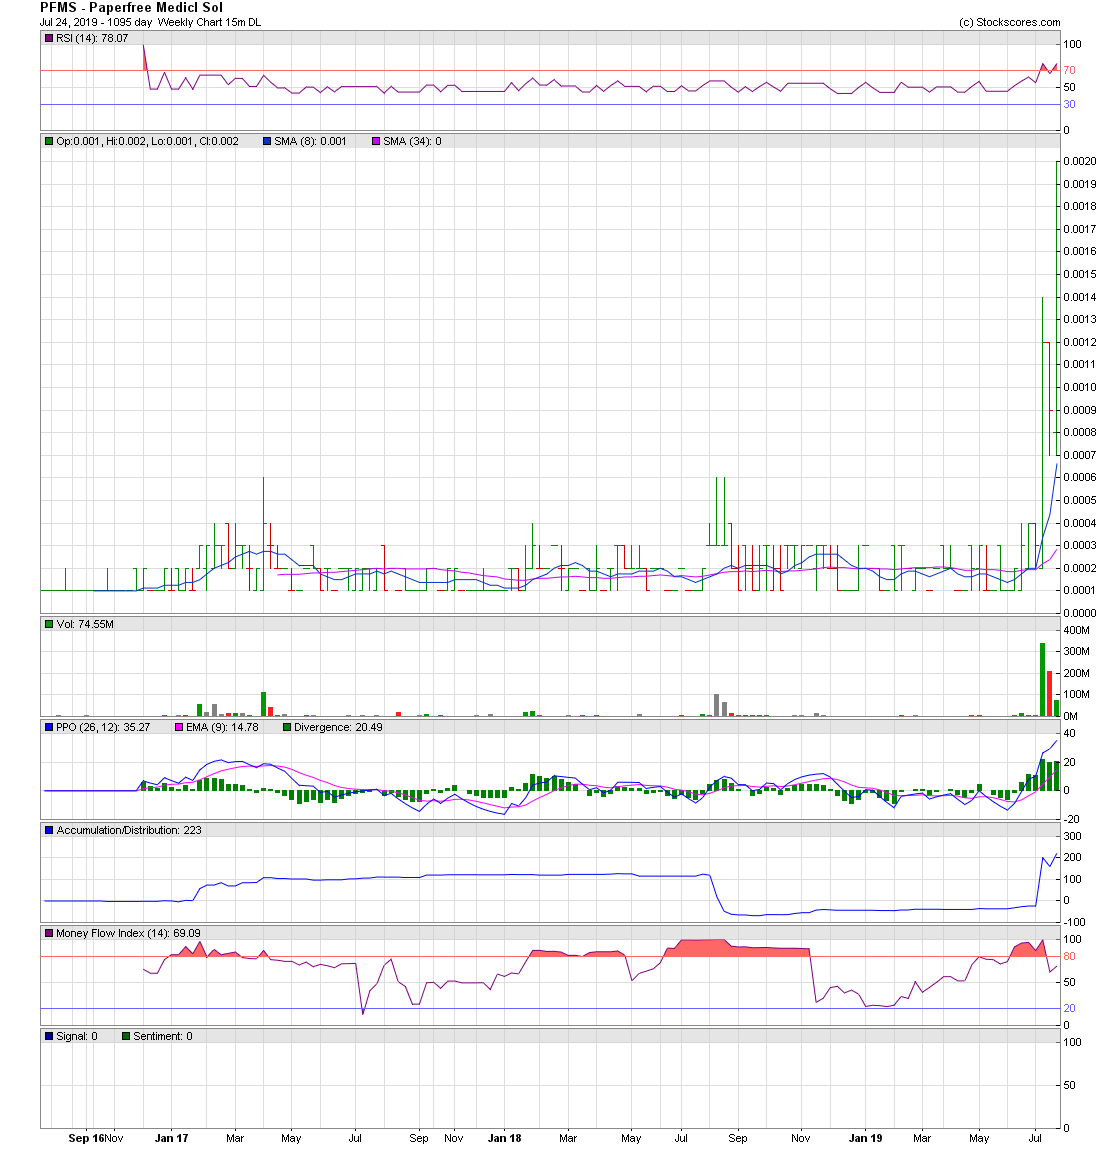
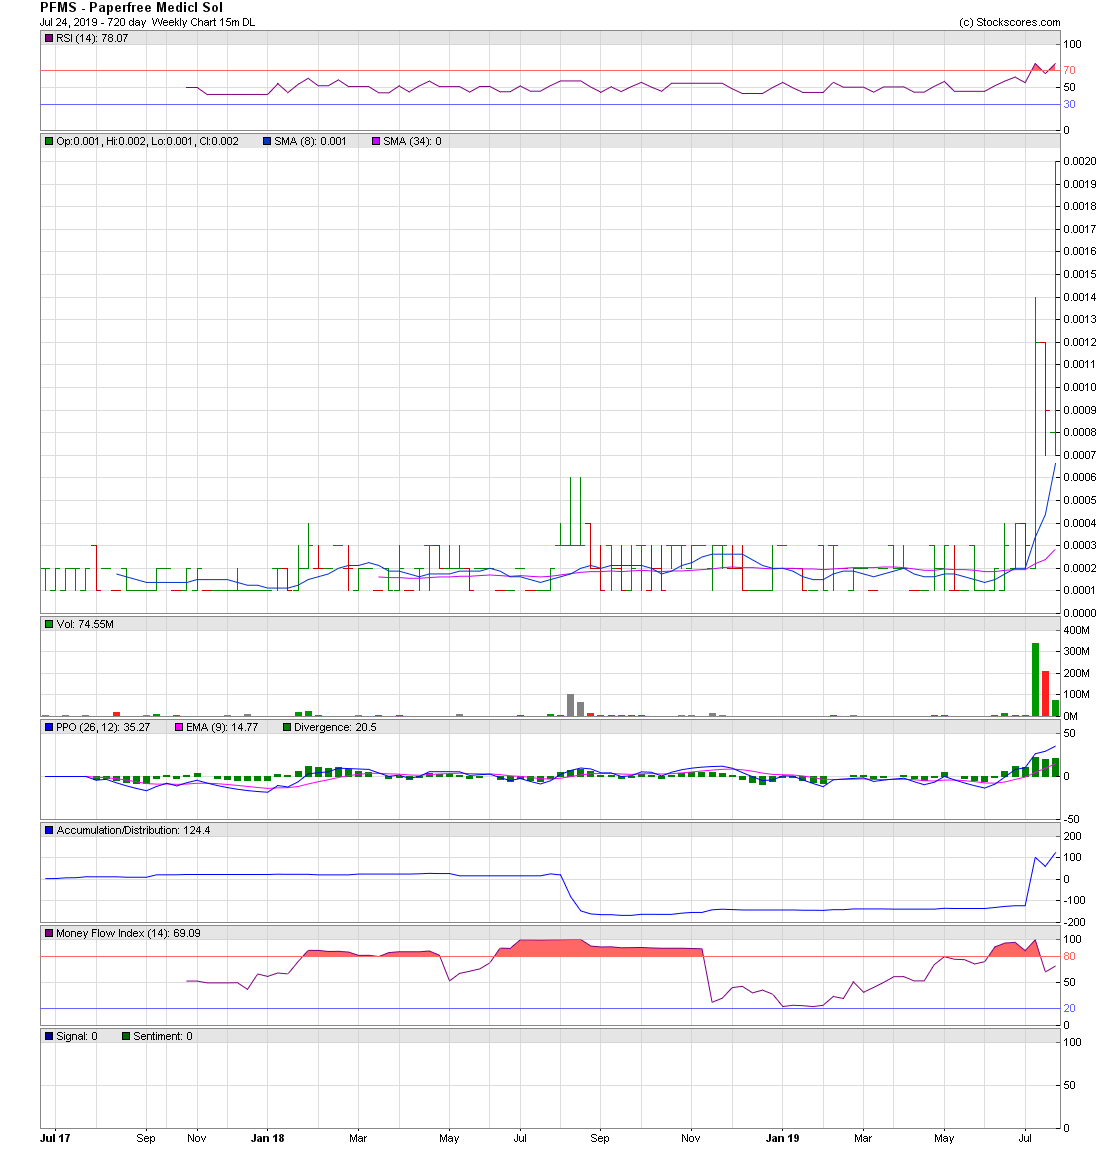
PFMS - Alerted at 0.0002
Climbs to 0.0071
https://investorshub.advfn.com/boards/read_msg.aspx?message_id=150986354
https://investorshub.advfn.com/boards/read_msg.aspx?message_id=150845043
https://investorshub.advfn.com/boards/read_msg.aspx?message_id=150845055
https://investorshub.advfn.com/boards/read_msg.aspx?message_id=150845062
https://investorshub.advfn.com/boards/read_msg.aspx?message_id=150845064
https://investorshub.advfn.com/boards/read_msg.aspx?message_id=150735869
https://investorshub.advfn.com/boards/read_msg.aspx?message_id=150735866
https://investorshub.advfn.com/boards/read_msg.aspx?message_id=150735856
https://investorshub.advfn.com/boards/read_msg.aspx?message_id=150683050
https://investorshub.advfn.com/boards/read_msg.aspx?message_id=150627563
https://investorshub.advfn.com/boards/read_msg.aspx?message_id=150622498
https://investorshub.advfn.com/boards/read_msg.aspx?message_id=150622281
https://investorshub.advfn.com/boards/read_msg.aspx?message_id=150622177
https://investorshub.advfn.com/boards/read_msg.aspx?message_id=150622010
https://investorshub.advfn.com/boards/read_msg.aspx?message_id=150480964
https://investorshub.advfn.com/boards/read_msg.aspx?message_id=150411336
https://investorshub.advfn.com/boards/read_msg.aspx?message_id=150282469
https://investorshub.advfn.com/boards/read_msg.aspx?message_id=150277287
https://investorshub.advfn.com/boards/read_msg.aspx?message_id=150277114
https://investorshub.advfn.com/boards/read_msg.aspx?message_id=150276982
https://investorshub.advfn.com/boards/read_msg.aspx?message_id=150231152
https://investorshub.advfn.com/boards/read_msg.aspx?message_id=150208554
https://investorshub.advfn.com/boards/read_msg.aspx?message_id=150208562
https://investorshub.advfn.com/boards/read_msg.aspx?message_id=150208560
https://investorshub.advfn.com/boards/read_msg.aspx?message_id=150117626
https://investorshub.advfn.com/boards/read_msg.aspx?message_id=150117715
https://investorshub.advfn.com/boards/read_msg.aspx?message_id=150118027
https://investorshub.advfn.com/boards/read_msg.aspx?message_id=149903767
https://investorshub.advfn.com/boards/read_msg.aspx?message_id=149904216
_____________________________________________________________
PFMS Security Details
Share Structure
Market Value1...........$375,248 a/o Aug 29, 2019
Authorized Shares..Not Available
Outstanding Shares 93,811,908 a/o Oct 09, 2007
-Restricted.....…....Not Available
-Unrestricted........Not Available
-Held at DTC.........Not Available
Float................Not Available
Par Value 0.0001
https://www.otcmarkets.com/stock/PFMS/security
________________________________________________________________
ACTL Security Details
Share Structure
Market Value1.............$139,844 a/o Feb 10, 2020
Authorized Shares..10,000,000,000 a/o Mar 21, 2017
Outstanding Shares....699,217,523 a/o Jun 13, 2016
Float.................674,500,000 a/o Jun 13, 2016
Par Value 0.001
https://www.otcmarkets.com/stock/ACTL/security
________________________________________________________________

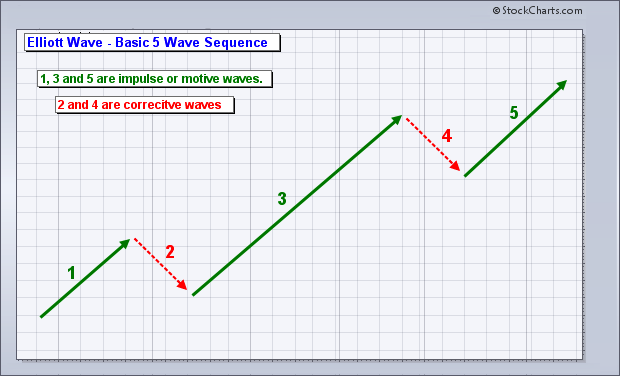
Buy after an Elliott Wave 5-Wave Decline
https://investorshub.advfn.com/boards/read_msg.aspx?message_id=147897807
________________________________________________________________
The Elliott Wave 5-Waves Sequence
A Basic "A,B,C Corrective Wave"
https://www.metatrader5.com/en/terminal/help/objects/elliott/elliott_theory
________________________________________________________________


Elliott Wave Basics
http://www.acrotec.com/ewt.htm
Elliott Wave Theory
http://ta.mql4.com/elliott_wave_theory
Buy after an Elliott Wave,
5-Wave decline sequence !
A Basic "A,B,C Corrective Wave"
Buy, ONLY when the stocks price,
is trading under the Blue 8-day M.A.
when the Blue 8-day M.A. is under the Red 34-day M.A.
________________________________________________________________
Live! and Embedded Charts
Buy, ONLY when the stocks price,
is trading under the Blue 8-day M.A.
when the Blue 8-day M.A. is under the Red 34-day M.A.


________________________________________________________________
Live! and Embedded Charts
Buy, ONLY when the stocks price,
is trading under the Blue 8-day M.A.
when the Blue 8-day M.A. is under the Red 34-day M.A.


________________________________________________________________
Live! and Embedded Charts
Buy, ONLY when the stocks price,
is trading under the Blue 8-day M.A.
when the Blue 8-day M.A. is under the Red 34-day M.A.

________________________________________________________________
Live! and Embedded Charts
Buy, ONLY when the stocks price,
is trading under the Blue 8-day M.A.
when the Blue 8-day M.A. is under the Red 34-day M.A.

________________________________________________________________
Live! and Embedded Charts
Buy, ONLY when the stocks price,
is trading under the Blue 8-day M.A.
when the Blue 8-day M.A. is under the Red 34-day M.A.

________________________________________________________________
Live! and Embedded Charts
Buy, ONLY when the stocks price,
is trading under the Blue 8-day M.A.
when the Blue 8-day M.A. is under the Red 34-day M.A.


________________________________________________________________
Live! and Embedded Charts
Buy, ONLY when the stocks price,
is trading under the Blue 8-day M.A.
when the Blue 8-day M.A. is under the Red 34-day M.A.

________________________________________________________________
Live! and Embedded Charts
Buy, ONLY when the stocks price,
is trading under the Blue 8-day M.A.
when the Blue 8-day M.A. is under the Red 34-day M.A.
________________________________________________________________
Live! and Embedded Charts
Buy, ONLY when the stocks price,
is trading under the Blue 8-day M.A.
when the Blue 8-day M.A. is under the Red 34-day M.A.
________________________________________________________________
Live! and Embedded Charts
Buy, ONLY when the stocks price,
is trading under the Blue 8-day M.A.
when the Blue 8-day M.A. is under the Red 34-day M.A.
________________________________________________________________
Live! and Embedded Charts
Buy, ONLY when the stocks price,
is trading under the Blue 8-day M.A.
when the Blue 8-day M.A. is under the Red 34-day M.A.
________________________________________________________________
Live! and Embedded Charts
Buy, ONLY when the stocks price,
is trading under the Blue 8-day M.A.
when the Blue 8-day M.A. is under the Red 34-day M.A.

_________________________________________________________________
Buy after an Elliott Wave,
5-Wave decline sequence !
A Basic "A,B,C Corrective Wave"
Buy, ONLY when the stocks price,
is trading under the Blue 8-day M.A.
when the Blue 8-day M.A. is under the Red 34-day M.A.
_______________________________________________________________
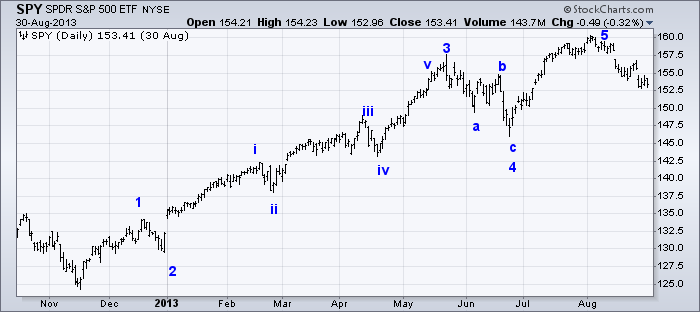
Sell after a EW 5-Wave Advance
________________________________________________________________
The Elliott Wave 5-Waves Sequence
A Basic "A,B,C Corrective Wave"
https://www.metatrader5.com/en/terminal/help/objects/elliott/elliott_theory
________________________________________________________________

________________________________________________________________
Impulse Wave 1 - The Accumulation Stage
the Wave right after a prolonged downtrend.
Wave 1
The stock makes its initial move upwards.
This is usually caused
by a relatively small number of people
that all of the sudden
(for a variety of reasons, real or imagined)
feel that the price of the stock is cheap
so it’s a perfect time to buy.
This causes the price to rise.
Wave 2 - Stock Declines
At this point,
enough people who were in the original wave
consider the stock overvalued and take profits.
This causes the stock to go down.
However, the stock will not make it to its previous lows
before the stock is considered a bargain again
Wave 3
This is usually the longest and strongest wave.
The stock has caught the attention of the mass public.
More people find out about the stock and want to buy it.
This causes the stock’s price to go higher and higher.
This wave usually exceeds the high created at the end of Wave 1.
Wave 4
Traders take profits
because the stock is considered expensive again.
This Wave tends to be weak
because there are usually more people
that are still bullish on the stock
and are waiting to “buy on the dips.”
Wave 5
This is the point that most people get in on the stock,
and is mostly driven by hysteria.
You usually start seeing the CEO of the company
on the front page of major magazines
as the Person of the Year.
Traders and investors start coming up with
ridiculous reasons to buy the stock
and try to choke you when you disagree with them.
This is when the stock becomes the most overpriced.
Contrarians start shorting the stock
which starts the ABC pattern.
________________________________________________________________

I'll Alert you of stocks to Buy,
before the Run happens !

_____________________________________________________________
PFMS - Alerted at 0.0002
Climbs to 0.0071
https://investorshub.advfn.com/boards/read_msg.aspx?message_id=150986354
https://investorshub.advfn.com/boards/read_msg.aspx?message_id=150845043
https://investorshub.advfn.com/boards/read_msg.aspx?message_id=150845055
https://investorshub.advfn.com/boards/read_msg.aspx?message_id=150845062
https://investorshub.advfn.com/boards/read_msg.aspx?message_id=150845064
https://investorshub.advfn.com/boards/read_msg.aspx?message_id=150735869
https://investorshub.advfn.com/boards/read_msg.aspx?message_id=150735866
https://investorshub.advfn.com/boards/read_msg.aspx?message_id=150735856
https://investorshub.advfn.com/boards/read_msg.aspx?message_id=150683050
https://investorshub.advfn.com/boards/read_msg.aspx?message_id=150627563
https://investorshub.advfn.com/boards/read_msg.aspx?message_id=150622498
https://investorshub.advfn.com/boards/read_msg.aspx?message_id=150622281
https://investorshub.advfn.com/boards/read_msg.aspx?message_id=150622177
https://investorshub.advfn.com/boards/read_msg.aspx?message_id=150622010
https://investorshub.advfn.com/boards/read_msg.aspx?message_id=150480964
https://investorshub.advfn.com/boards/read_msg.aspx?message_id=150411336
https://investorshub.advfn.com/boards/read_msg.aspx?message_id=150282469
https://investorshub.advfn.com/boards/read_msg.aspx?message_id=150277287
https://investorshub.advfn.com/boards/read_msg.aspx?message_id=150277114
https://investorshub.advfn.com/boards/read_msg.aspx?message_id=150276982
https://investorshub.advfn.com/boards/read_msg.aspx?message_id=150231152
https://investorshub.advfn.com/boards/read_msg.aspx?message_id=150208554
https://investorshub.advfn.com/boards/read_msg.aspx?message_id=150208562
https://investorshub.advfn.com/boards/read_msg.aspx?message_id=150208560
https://investorshub.advfn.com/boards/read_msg.aspx?message_id=150117626
https://investorshub.advfn.com/boards/read_msg.aspx?message_id=150117715
https://investorshub.advfn.com/boards/read_msg.aspx?message_id=150118027
https://investorshub.advfn.com/boards/read_msg.aspx?message_id=149903767
https://investorshub.advfn.com/boards/read_msg.aspx?message_id=149904216
_____________________________________________________________
PFMS Security Details
Share Structure
Market Value1...........$375,248 a/o Aug 29, 2019
Authorized Shares..Not Available
Outstanding Shares 93,811,908 a/o Oct 09, 2007
-Restricted.....…....Not Available
-Unrestricted........Not Available
-Held at DTC.........Not Available
Float................Not Available
Par Value 0.0001
https://www.otcmarkets.com/stock/PFMS/security
________________________________________________________________
ACTL Security Details
Share Structure
Market Value1.............$139,844 a/o Feb 10, 2020
Authorized Shares..10,000,000,000 a/o Mar 21, 2017
Outstanding Shares....699,217,523 a/o Jun 13, 2016
Float.................674,500,000 a/o Jun 13, 2016
Par Value 0.001
https://www.otcmarkets.com/stock/ACTL/security
________________________________________________________________

Buy after an Elliott Wave 5-Wave Decline
https://investorshub.advfn.com/boards/read_msg.aspx?message_id=147897807
________________________________________________________________
The Elliott Wave 5-Waves Sequence
A Basic "A,B,C Corrective Wave"
https://www.metatrader5.com/en/terminal/help/objects/elliott/elliott_theory
________________________________________________________________


Elliott Wave Basics
http://www.acrotec.com/ewt.htm
Elliott Wave Theory
http://ta.mql4.com/elliott_wave_theory
Buy after an Elliott Wave,
5-Wave decline sequence !
A Basic "A,B,C Corrective Wave"
Buy, ONLY when the stocks price,
is trading under the Blue 8-day M.A.
when the Blue 8-day M.A. is under the Red 34-day M.A.
________________________________________________________________
Live! and Embedded Charts
Buy, ONLY when the stocks price,
is trading under the Blue 8-day M.A.
when the Blue 8-day M.A. is under the Red 34-day M.A.

________________________________________________________________
Live! and Embedded Charts
Buy, ONLY when the stocks price,
is trading under the Blue 8-day M.A.
when the Blue 8-day M.A. is under the Red 34-day M.A.

________________________________________________________________
Live! and Embedded Charts
Buy, ONLY when the stocks price,
is trading under the Blue 8-day M.A.
when the Blue 8-day M.A. is under the Red 34-day M.A.

________________________________________________________________
Live! and Embedded Charts
Buy, ONLY when the stocks price,
is trading under the Blue 8-day M.A.
when the Blue 8-day M.A. is under the Red 34-day M.A.

________________________________________________________________
Live! and Embedded Charts
Buy, ONLY when the stocks price,
is trading under the Blue 8-day M.A.
when the Blue 8-day M.A. is under the Red 34-day M.A.

________________________________________________________________
Live! and Embedded Charts
Buy, ONLY when the stocks price,
is trading under the Blue 8-day M.A.
when the Blue 8-day M.A. is under the Red 34-day M.A.
________________________________________________________________
Live! and Embedded Charts
Buy, ONLY when the stocks price,
is trading under the Blue 8-day M.A.
when the Blue 8-day M.A. is under the Red 34-day M.A.

________________________________________________________________
Live! and Embedded Charts
Buy, ONLY when the stocks price,
is trading under the Blue 8-day M.A.
when the Blue 8-day M.A. is under the Red 34-day M.A.

________________________________________________________________
Live! and Embedded Charts
Buy, ONLY when the stocks price,
is trading under the Blue 8-day M.A.
when the Blue 8-day M.A. is under the Red 34-day M.A.

________________________________________________________________
Live! and Embedded Charts
Buy, ONLY when the stocks price,
is trading under the Blue 8-day M.A.
when the Blue 8-day M.A. is under the Red 34-day M.A.

________________________________________________________________
Live! and Embedded Charts
Buy, ONLY when the stocks price,
is trading under the Blue 8-day M.A.
when the Blue 8-day M.A. is under the Red 34-day M.A.

________________________________________________________________
Live! and Embedded Charts
Buy, ONLY when the stocks price,
is trading under the Blue 8-day M.A.
when the Blue 8-day M.A. is under the Red 34-day M.A.
_________________________________________________________________
Buy after an Elliott Wave,
5-Wave decline sequence !
A Basic "A,B,C Corrective Wave"
Buy, ONLY when the stocks price,
is trading under the Blue 8-day M.A.
when the Blue 8-day M.A. is under the Red 34-day M.A.
_______________________________________________________________
Sell after a EW 5-Wave Advance
________________________________________________________________
The Elliott Wave 5-Waves Sequence
A Basic "A,B,C Corrective Wave"
https://www.metatrader5.com/en/terminal/help/objects/elliott/elliott_theory
________________________________________________________________


________________________________________________________________
Impulse Wave 1 - The Accumulation Stage
the Wave right after a prolonged downtrend.
Wave 1
The stock makes its initial move upwards.
This is usually caused
by a relatively small number of people
that all of the sudden
(for a variety of reasons, real or imagined)
feel that the price of the stock is cheap
so it’s a perfect time to buy.
This causes the price to rise.
Wave 2 - Stock Declines
At this point,
enough people who were in the original wave
consider the stock overvalued and take profits.
This causes the stock to go down.
However, the stock will not make it to its previous lows
before the stock is considered a bargain again
Wave 3
This is usually the longest and strongest wave.
The stock has caught the attention of the mass public.
More people find out about the stock and want to buy it.
This causes the stock’s price to go higher and higher.
This wave usually exceeds the high created at the end of Wave 1.
Wave 4
Traders take profits
because the stock is considered expensive again.
This Wave tends to be weak
because there are usually more people
that are still bullish on the stock
and are waiting to “buy on the dips.”
Wave 5
This is the point that most people get in on the stock,
and is mostly driven by hysteria.
You usually start seeing the CEO of the company
on the front page of major magazines
as the Person of the Year.
Traders and investors start coming up with
ridiculous reasons to buy the stock
and try to choke you when you disagree with them.
This is when the stock becomes the most overpriced.
Contrarians start shorting the stock
which starts the ABC pattern.
________________________________________________________________


Discover What Traders Are Watching
Explore small cap ideas before they hit the headlines.


