


| Followers | 679 |
| Posts | 141019 |
| Boards Moderated | 36 |
| Alias Born | 03/10/2004 |
Thursday, February 13, 2020 8:03:21 AM
By: Julius de Kempenaer | February 13, 2020
* (Click Read Full Story »»» at the bottom of the page for the charts to appear on the post)
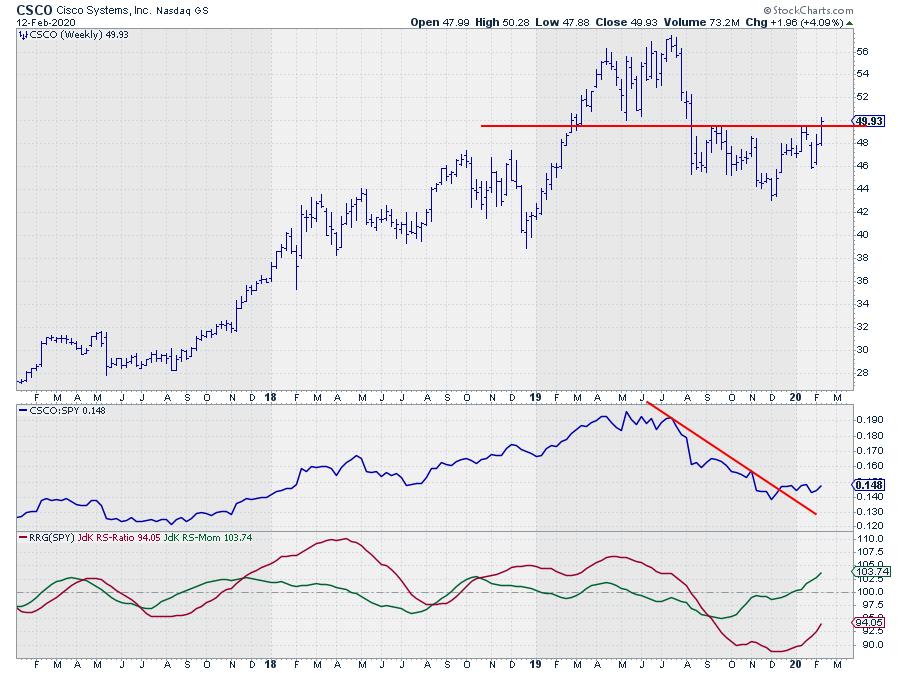
CSCO peaked in the first half of 2019. The first time at $ 56.30 in April and then again in July at $ 57.40. A typical failure to convincingly break above a previous high. From July onward CSCO moved lower to a low around $ 43 at the start of December.
The formation that triggers my interest is the inverted H&S like pattern that traced out after the first steep drop.
This stock also caught the attention on the Relative Rotation Graph for Dow components, where it is positioned inside the improving quadrant and travelling towards leading at a strong RRG-Heading.

At the same time we find WMT inside the lagging quadrant and travelling further into it.

The price chart of WMT also looks quite the opposite of CSCO with a potential top being put into place and price now struggling to hold at or above the rising support line.
The relative strength of WMT (vs SPY) is sending a very clear signal. The upward trend has been broken and the most likely move is further down.
This opposite rotation on the RRG in combination with strong, for CSCO, and weak, for WMT, price charts make a direct comparison between these two stocks interesting.

The ratio of CSCO vs WMT shows a rally out of its December low which has taken out two previous highs after which a first higher low has been set. At the moment the ratio is pushing against the early Jan high and a break of that level will very likely ignite more upside.
The positive divergence between the ratio and its RSI is supportive for a further move higher, which makes an outperformance of CSCO over WMT in coming weeks likely.
-- Julius
Read Full Story »»»
 DiscoverGold
Information posted to this board is not meant to suggest any specific action, but to point out the technical signs that can help our readers make their own specific decisions. Caveat emptor!
• DiscoverGold
Recent CSCO News
- BHP Bids $38.8 Billion for Anglo American; Biden Unveils Historic Micron Technology Deal, and More News • IH Market News • 04/25/2024 11:48:40 AM
- Cisco and Morgan Solar unlock clean energy adoption in office spaces • GlobeNewswire Inc. • 04/22/2024 03:00:54 PM
- Li Auto Stock Drops 7.3% Amid Tesla Price Cuts, Salesforce Retreats from Informatica Deal, and Other Market Updates • IH Market News • 04/22/2024 12:09:21 PM
- Cisco Reimagines Security for Data Centers and Clouds in Era of AI • PR Newswire (Canada) • 04/18/2024 07:00:00 AM
- Cisco Reimagines Security for Data Centers and Clouds in Era of AI • PR Newswire (US) • 04/18/2024 07:00:00 AM
- Cisco Completes Acquisition of Isovalent to Define the Future of Multicloud Networking and Security • PR Newswire (US) • 04/12/2024 10:35:00 PM
- Cisco to Host Tech Talk on Splunk • PR Newswire (US) • 04/10/2024 08:30:00 PM
- FMP Alliance Forms to Advance Innovative Fault Managed Power Technology • PR Newswire (US) • 04/08/2024 01:15:00 PM
- Cisco and BoA to Host Tech Talk on Security from RSA 2024 • PR Newswire (US) • 04/04/2024 12:00:00 PM
- Leading Companies Launch Consortium to Address AI's Impact on the Technology Workforce • PR Newswire (US) • 04/04/2024 11:30:00 AM
- Analysts’ Recommendations for March 27th: FedEx, Visa, Uber, Adobe… • IH Market News • 03/27/2024 12:13:10 PM
- Cisco Study Reveals Very Few Organizations in Canada Prepared to Defend Against Today's Rapidly Evolving Threat Landscape • GlobeNewswire Inc. • 03/27/2024 10:00:00 AM
- Cisco Study Reveals Very Few Organizations Prepared to Defend Against Today's Rapidly Evolving Threat Landscape • PR Newswire (US) • 03/27/2024 07:17:00 AM
- Cisco Hybrid Work Study Reveals Companies' Need to Modernize Offices • PR Newswire (US) • 03/26/2024 03:00:00 PM
- Cisco and Ford Motor Company Rollout Webex App for Productivity on the Move • PR Newswire (US) • 03/26/2024 03:00:00 PM
- Cisco Furthers Customer Experience Momentum with New Offerings That Extend Customer Value • PR Newswire (US) • 03/26/2024 03:00:00 PM
- Cisco Announces New Multifunctional Collaboration Devices for Hybrid Work • PR Newswire (US) • 03/25/2024 03:00:00 PM
- Cisco Completes Acquisition of Splunk • PR Newswire (US) • 03/18/2024 12:40:00 PM
- Cisco Completes Acquisition of Splunk • PR Newswire (Canada) • 03/18/2024 12:30:00 PM
- Cisco Completes Acquisition of Splunk • PR Newswire (US) • 03/18/2024 12:30:00 PM
- Adobe Stock Drops Following Below-Estimate Projections, Cardlytics Surges with Unexpected Profit, and More News • IH Market News • 03/15/2024 11:30:55 AM
- Cisco and Raymond James to Host a Tech Talk at OFC 2024 • PR Newswire (US) • 03/13/2024 12:00:00 PM
- RAI Amsterdam Selects Cisco and Radware for Cloud Security • GlobeNewswire Inc. • 03/13/2024 10:00:00 AM
- Form 144 - Report of proposed sale of securities • Edgar (US Regulatory) • 03/11/2024 08:32:23 PM
- Form 4 - Statement of changes in beneficial ownership of securities • Edgar (US Regulatory) • 03/07/2024 09:21:02 PM
FEATURED NanoViricides Reports that the Phase I NV-387 Clinical Trial is Completed Successfully and Data Lock is Expected Soon • May 2, 2024 10:07 AM
ILUS Files Form 10-K and Provides Shareholder Update • ILUS • May 2, 2024 8:52 AM
Avant Technologies Names New CEO Following Acquisition of Healthcare Technology and Data Integration Firm • AVAI • May 2, 2024 8:00 AM
Bantec Engaged in a Letter of Intent to Acquire a Small New Jersey Based Manufacturing Company • BANT • May 1, 2024 10:00 AM
Cannabix Technologies to Deliver Breath Logix Alcohol Screening Device to Australia • BLO • Apr 30, 2024 8:53 AM
Hydromer, Inc. Reports Preliminary Unaudited Financial Results for First Quarter 2024 • HYDI • Apr 29, 2024 9:10 AM

