Wednesday, February 12, 2020 10:16:04 AM
I'll Alert you of stocks to Buy,
before the Run happens !
_____________________________________________________________
FONU Security Details
Share Structure
Market Value1..........$610,153 a/o Feb 11, 2020
Authorized Shares...2,000,000,000 a/o Feb 03, 2020
Outstanding Shares..1,016,920,999 a/o Feb 03, 2020
-Restricted.............32,516,624 a/o Feb 03, 2020
-Unrestricted..........984,404,375 a/o Feb 03, 2020
Held at DTC............984,199,645 a/o Feb 03, 2020
Float................34,650,040 a/o Apr 22, 2015
Par Value 0.001
15-12G
06/28/2016
https://www.otcmarkets.com/filing/html?id=11463495&guid=tz_CUqA2mBADM3h
SEC Form
15-12G
https://www.investopedia.com/terms/s/sec-form-15-12g.asp
https://www.otcmarkets.com/stock/FONU/security
http://www.otcmarkets.com/stock/FONU/profile
http://www.allotcbb.com/quote.php?symbol=FONU
https://www.barchart.com/stocks/quotes/FONU
http://www.investorpoint.com/stock/FONU-FonU2+Inc/price-history/
https://www.stockscores.com/charts/charts/?ticker=FONU
FONU - Charts / News / Targets / Strategy
https://investorshub.advfn.com/boards/read_msg.aspx?message_id=151464104
________________________________________________________________
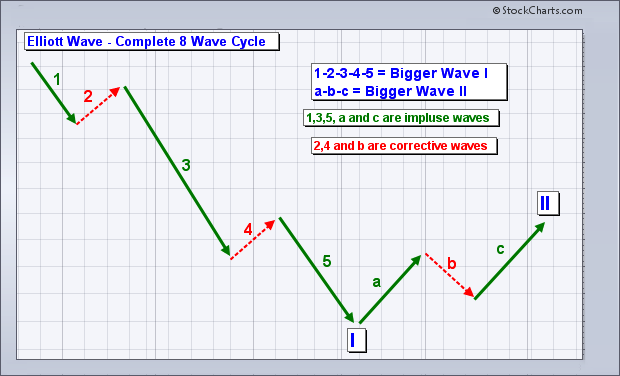
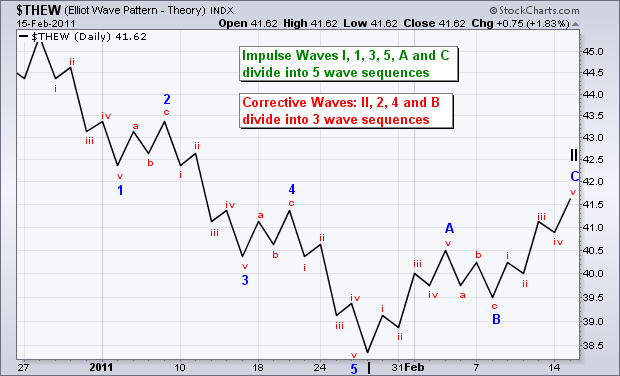
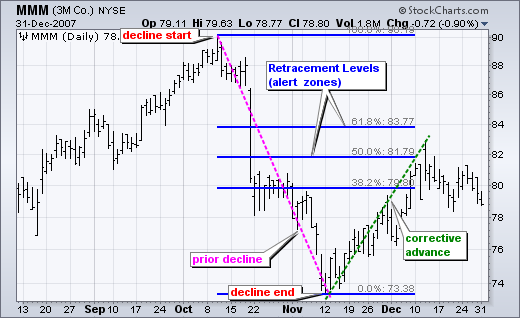
Buy after an Elliott Wave 5-Wave Decline
https://investorshub.advfn.com/boards/read_msg.aspx?message_id=147897807
________________________________________________________________
The Elliott Wave 5-Waves Sequence
A Basic "A,B,C Corrective Wave"
https://www.metatrader5.com/en/terminal/help/objects/elliott/elliott_theory
________________________________________________________________


Elliott Wave Basics
http://www.acrotec.com/ewt.htm
Elliott Wave Theory
http://ta.mql4.com/elliott_wave_theory
Buy after an Elliott Wave,
5-Wave decline sequence !
A Basic "A,B,C Corrective Wave"
Buy, ONLY when the stocks price,
is trading under the Blue 8-day M.A.
when the Blue 8-day M.A. is under the Red 34-day M.A.
________________________________________________________________
Live! Charts
________________________________________________________________


________________________________________________________________


________________________________________________________________


________________________________________________________________


FEATURED BNCM and DELEX Healthcare Group Announce Strategic Merger to Drive Expansion and Growth • Jul 2, 2024 7:19 AM
EWRC's 21 Moves Gaming Studios Moves to SONY Pictures Studios and Green Lights Development of a Third Upcoming Game • EWRC • Jul 2, 2024 8:00 AM
NUBURU Announces Upcoming TV Interview Featuring CEO Brian Knaley on Fox Business, Bloomberg TV, and Newsmax TV as Sponsored Programming • BURU • Jul 1, 2024 1:57 PM
Mass Megawatts Announces $220,500 Debt Cancellation Agreement to Improve Financing and Sales of a New Product to be Announced on July 11 • MMMW • Jun 28, 2024 7:30 AM
VAYK Exited Caribbean Investments for $320,000 Profit • VAYK • Jun 27, 2024 9:00 AM
North Bay Resources Announces Successful Flotation Cell Test at Bishop Gold Mill, Inyo County, California • NBRI • Jun 27, 2024 9:00 AM


