


Saturday, January 18, 2020 1:11:37 AM
S&P 500 - for Tuesday, January 21, 2020
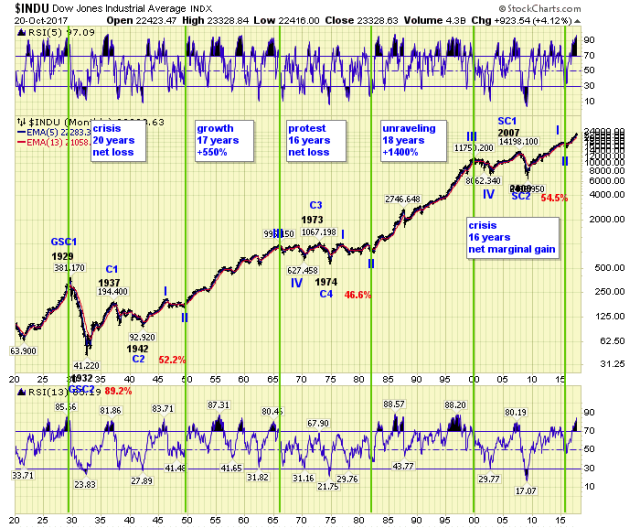
DJIA Projection: 100,000 by 2032 / 2033
LONG TERM: Bull Market
MEDIUM TERM: Uptrend
https://caldaro.wordpress.com/
________________________________________________________________

----------------------------------------------------------------
Saturday UPDATE:
Posted on January 18, 2020
by christine caldaro
https://caldaro.wordpress.com/
________________________________________________________________
________________________________________________________________
The Kick-Off Months in the OTC - Jan/Feb - Jun/Jul
https://investorshub.advfn.com/boards/read_msg.aspx?message_id=149287770
https://stockcharts.com/h-sc/ui?s=%24SPX&p=W&yr=5&mn=0&dy=0&id=p7587581294c
_________________________________________________________________
The 2018-2019 Bear Market
resembles the
1990 Bear Market
The 2018-2019 Bear Market has Bottomed
Major Wave 3 - Now underway.
Keep in mind
we are in a Secular generational Bull Market,
and we are not expecting it to top
until the early 2030’s
_________________________________________________________________
_________________________________________________________________

_________________________________________________________________
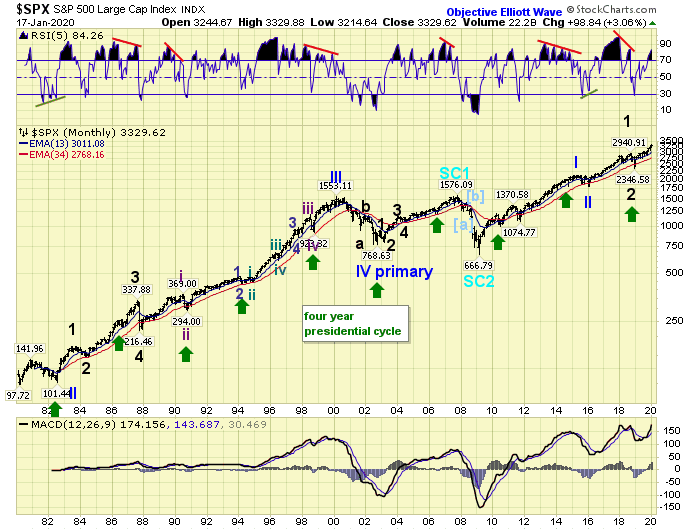
In the US the long term count remains unchanged.
Super cycle SC2
Low March 2009.
Primary I
High
May 2015,
and
Primary II
Low
February 2016.
________________________________________________________________
Major Wave 1
high
October 2018
Major Wave 2
low
December 2018
________________________________________________________________
Intermediate wave i of Major 3
is now underway
and is subdividing into Minor waves
________________________________________________________________
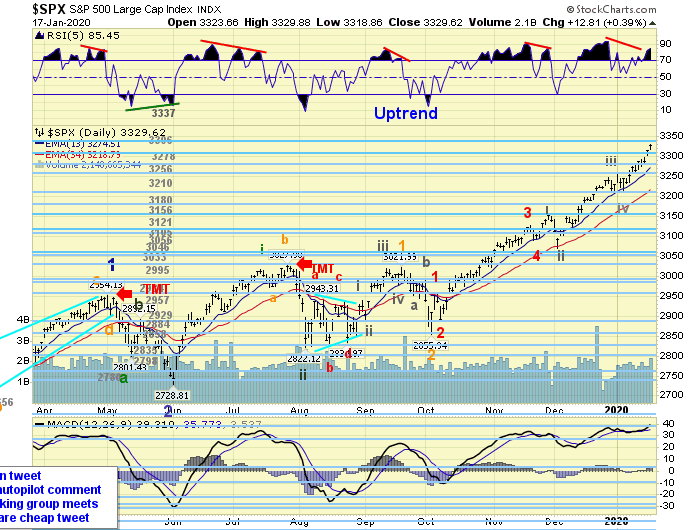
Minor waves 1 and 2
completed by the first trading day in June
and
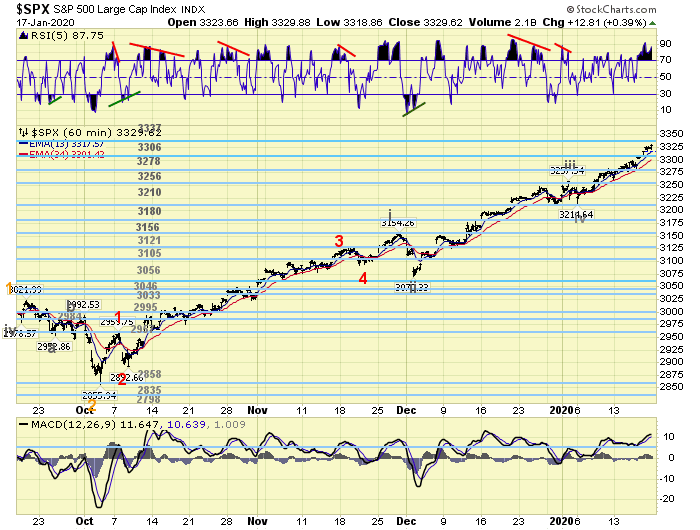
Minor wave 3
has been ongoing since then
________________________________________________________________
The 2019
Minor Wave 1
and
Minor Wave 2
resembles the
2012
Minor Wave 1
and
Minor Wave 2
________________________________________________________________
The 2018
Major Wave 1
and
Major Wave 2
resembles the
2011
Major Wave 1
and
Major Wave 2
________________________________________________________________
_________________________________________________________________
MEDIUM TERM: Uptrend
_________________________________________________________________
_________________________________________________________________
SHORT TERM:
_______________________________________________________________
_______________________________________________________________
Best to your trading!
_______________________________________________________________
Stock Scores Chart Links
https://www.stockscores.com/charts/charts/?ticker=%24SPX
http://stockcharts.com/h-sc/ui?s=%24SPX&p=D&yr=3&mn=0&dy=0&id=p16291900332
Live! Charts


________________________________________________________________
The previous Primary III wave,
which began in 1982,
was about 25 years
after the Baby Boom birth rate high of 1957.
The next cycle,
suggests the current OEW Primary III wave
began in 2016
about 25 years after
the Millennial peak birth rate of 1989.
What does all this mean?
If our beloved maestro’s thesis is correct,
and we think it is,
then it projects
DJIA 100,000 by 2032 / 2033
________________________________________
________________________________________________________________
DJIA Projection: 100,000 by 2032 / 2033
LONG TERM: Bull Market
MEDIUM TERM: Uptrend
https://caldaro.wordpress.com/
________________________________________________________________

----------------------------------------------------------------
Saturday UPDATE:
Posted on January 18, 2020
by christine caldaro
https://caldaro.wordpress.com/
________________________________________________________________

________________________________________________________________
The Kick-Off Months in the OTC - Jan/Feb - Jun/Jul
https://investorshub.advfn.com/boards/read_msg.aspx?message_id=149287770
https://stockcharts.com/h-sc/ui?s=%24SPX&p=W&yr=5&mn=0&dy=0&id=p7587581294c
_________________________________________________________________
The 2018-2019 Bear Market
resembles the
1990 Bear Market
The 2018-2019 Bear Market has Bottomed
Major Wave 3 - Now underway.
Keep in mind
we are in a Secular generational Bull Market,
and we are not expecting it to top
until the early 2030’s
_________________________________________________________________

_________________________________________________________________

_________________________________________________________________
In the US the long term count remains unchanged.
Super cycle SC2
Low March 2009.
Primary I
High
May 2015,
and
Primary II
Low
February 2016.
________________________________________________________________
Major Wave 1
high
October 2018
Major Wave 2
low
December 2018
________________________________________________________________
Intermediate wave i of Major 3
is now underway
and is subdividing into Minor waves
________________________________________________________________
Minor waves 1 and 2
completed by the first trading day in June
and
Minor wave 3
has been ongoing since then
________________________________________________________________
The 2019
Minor Wave 1
and
Minor Wave 2
resembles the
2012
Minor Wave 1
and
Minor Wave 2
________________________________________________________________
The 2018
Major Wave 1
and
Major Wave 2
resembles the
2011
Major Wave 1
and
Major Wave 2
________________________________________________________________
_________________________________________________________________
MEDIUM TERM: Uptrend
_________________________________________________________________

_________________________________________________________________
SHORT TERM:
_______________________________________________________________

_______________________________________________________________
Best to your trading!
_______________________________________________________________
Stock Scores Chart Links
https://www.stockscores.com/charts/charts/?ticker=%24SPX
http://stockcharts.com/h-sc/ui?s=%24SPX&p=D&yr=3&mn=0&dy=0&id=p16291900332
Live! Charts
________________________________________________________________
The previous Primary III wave,
which began in 1982,
was about 25 years
after the Baby Boom birth rate high of 1957.
The next cycle,
suggests the current OEW Primary III wave
began in 2016
about 25 years after
the Millennial peak birth rate of 1989.
What does all this mean?
If our beloved maestro’s thesis is correct,
and we think it is,
then it projects
DJIA 100,000 by 2032 / 2033
________________________________________
________________________________________________________________

Join the InvestorsHub Community
Register for free to join our community of investors and share your ideas. You will also get access to streaming quotes, interactive charts, trades, portfolio, live options flow and more tools.

