


Tuesday, December 03, 2019 12:43:57 AM
QMC is fundamentally sound, QTMM is technically bullish, something big is coming. If QMC has no future, share price would be already like other OTC listed stocks at sub-penny level. Test of break down from the November convergence failed to follow through, sharp breakout on the up side is imminent.
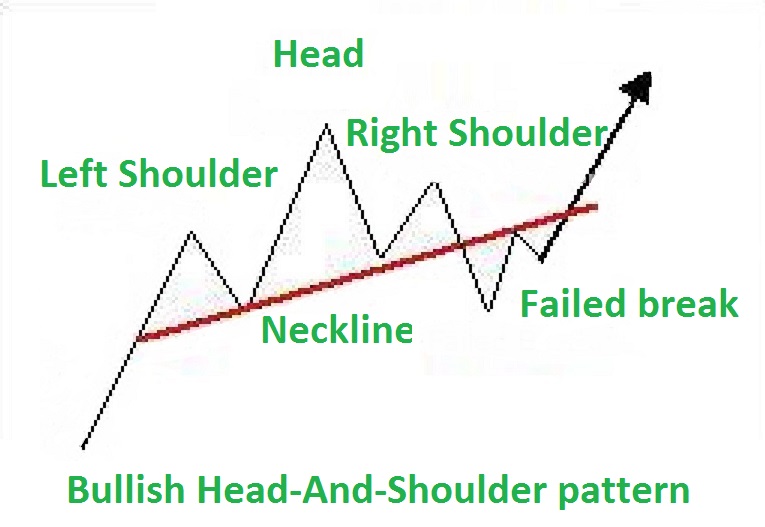
Bullish and Bearish Head-And-Shoulder patterns:
https://c.mql5.com/6/8/hhhh.jpg
QTMM monthly 2yr
http://bigcharts.marketwatch.com/kaavio.Webhost/charts/big.chart?nosettings=1&symb=QTMM&uf=0&type=2&size=2&sid=4700466&style=320&freq=3&entitlementtoken=0c33378313484ba9b46b8e24ded87dd6&time=9&rand=15852149&compidx=aaaaa%3a0&ma=0&maval=9&lf=32&lf2=4&lf3=2&height=553&width=579&mocktick=1

QTMM stands out among the crowd with an extremely bullish chart pattern:
1) http://bigcharts.marketwatch.com/advchart/frames/frames.asp?show=&insttype=Stock&symb=QTMM&x=48&y=12&time=9&startdate=1%2F4%2F1999&enddate=7%2F2%2F2011&freq=2&compidx=aaaaa%3A0&comptemptext=&comp=none&ma=0&maval=9&uf=0&lf=32&lf2=4&lf3=1&type=2&style=320&size=2&timeFrameToggle=false&compareToToggle=false&indicatorsToggle=false&chartStyleToggle=false&state=10
2) http://bigcharts.marketwatch.com/advchart/frames/frames.asp?show=&insttype=&symb=CCLX&x=0&y=0&time=9&startdate=1%2F4%2F1999&enddate=7%2F2%2F2011&freq=2&compidx=aaaaa%3A0&comptemptext=&comp=none&ma=0&maval=9&uf=0&lf=32&lf2=4&lf3=1&type=2&style=320&size=2&timeFrameToggle=false&compareToToggle=false&indicatorsToggle=false&chartStyleToggle=false&state=10
3) http://bigcharts.marketwatch.com/advchart/frames/frames.asp?show=&insttype=&symb=GNOW&x=0&y=0&time=9&startdate=1%2F4%2F1999&enddate=7%2F2%2F2011&freq=2&compidx=aaaaa%3A0&comptemptext=&comp=none&ma=0&maval=9&uf=0&lf=32&lf2=4&lf3=1&type=2&style=320&size=2&timeFrameToggle=false&compareToToggle=false&indicatorsToggle=false&chartStyleToggle=false&state=10
4) http://bigcharts.marketwatch.com/advchart/frames/frames.asp?show=&insttype=&symb=LNCLF&x=0&y=0&time=9&startdate=1%2F4%2F1999&enddate=7%2F2%2F2011&freq=2&compidx=aaaaa%3A0&comptemptext=&comp=none&ma=0&maval=9&uf=0&lf=32&lf2=4&lf3=1&type=2&style=320&size=2&timeFrameToggle=false&compareToToggle=false&indicatorsToggle=false&chartStyleToggle=false&state=10
There was chart in March but not anymore, looks like this one has gone out of business
5) http://bigcharts.marketwatch.com/advchart/frames/frames.asp?show=&insttype=&symb=ZNGY&x=0&y=0&time=9&startdate=1%2F4%2F1999&enddate=7%2F2%2F2011&freq=2&compidx=aaaaa%3A0&comptemptext=&comp=none&ma=0&maval=9&uf=0&lf=32&lf2=4&lf3=1&type=2&style=320&size=2&timeFrameToggle=false&compareToToggle=false&indicatorsToggle=false&chartStyleToggle=false&state=10
Share price reflects numerous Reverse split
6) http://bigcharts.marketwatch.com/advchart/frames/frames.asp?show=&insttype=&symb=PSON&x=0&y=0&time=9&startdate=1%2F4%2F1999&enddate=7%2F2%2F2011&freq=2&compidx=aaaaa%3A0&comptemptext=&comp=none&ma=0&maval=9&uf=0&lf=32&lf2=4&lf3=1&type=2&style=320&size=2&timeFrameToggle=false&compareToToggle=false&indicatorsToggle=false&chartStyleToggle=false&state=10
7) http://bigcharts.marketwatch.com/advchart/frames/frames.asp?show=&insttype=&symb=FPVD&x=0&y=0&time=9&startdate=1%2F4%2F1999&enddate=7%2F2%2F2011&freq=2&compidx=aaaaa%3A0&comptemptext=&comp=none&ma=0&maval=9&uf=0&lf=32&lf2=4&lf3=1&type=2&style=320&size=2&timeFrameToggle=false&compareToToggle=false&indicatorsToggle=false&chartStyleToggle=false&state=10
8) http://bigcharts.marketwatch.com/advchart/frames/frames.asp?show=&insttype=&symb=AEXE&x=0&y=0&time=9&startdate=1%2F4%2F1999&enddate=7%2F2%2F2011&freq=2&compidx=aaaaa%3A0&comptemptext=&comp=none&ma=0&maval=9&uf=0&lf=32&lf2=4&lf3=1&type=2&style=320&size=2&timeFrameToggle=false&compareToToggle=false&indicatorsToggle=false&chartStyleToggle=false&state=10
9) http://bigcharts.marketwatch.com/advchart/frames/frames.asp?show=&insttype=&symb=BONTQ&x=0&y=0&time=9&startdate=1%2F4%2F1999&enddate=7%2F2%2F2011&freq=2&compidx=aaaaa%3A0&comptemptext=&comp=none&ma=0&maval=9&uf=0&lf=32&lf2=4&lf3=1&type=2&style=320&size=2&timeFrameToggle=false&compareToToggle=false&indicatorsToggle=false&chartStyleToggle=false&state=10
10) http://bigcharts.marketwatch.com/advchart/frames/frames.asp?show=&insttype=&symb=RIHT&x=0&y=0&time=9&startdate=1%2F4%2F1999&enddate=7%2F2%2F2011&freq=2&compidx=aaaaa%3A0&comptemptext=&comp=none&ma=0&maval=9&uf=0&lf=32&lf2=4&lf3=1&type=2&style=320&size=2&timeFrameToggle=false&compareToToggle=false&indicatorsToggle=false&chartStyleToggle=false&state=10
11) http://bigcharts.marketwatch.com/advchart/frames/frames.asp?show=&insttype=&symb=SNPW&x=53&y=11&time=9&startdate=1%2F4%2F1999&enddate=7%2F2%2F2011&freq=2&compidx=aaaaa%3A0&comptemptext=&comp=none&ma=0&maval=9&uf=0&lf=32&lf2=4&lf3=1&type=2&style=320&size=2&timeFrameToggle=false&compareToToggle=false&indicatorsToggle=false&chartStyleToggle=false&state=10
12) http://bigcharts.marketwatch.com/advchart/frames/frames.asp?show=&insttype=&symb=CBBT&x=0&y=0&time=9&startdate=1%2F4%2F1999&enddate=7%2F2%2F2011&freq=2&compidx=aaaaa%3A0&comptemptext=&comp=none&ma=0&maval=9&uf=0&lf=32&lf2=4&lf3=1&type=2&style=320&size=2&timeFrameToggle=false&compareToToggle=false&indicatorsToggle=false&chartStyleToggle=false&state=10
13) http://bigcharts.marketwatch.com/advchart/frames/frames.asp?show=&insttype=&symb=ABCE&x=0&y=0&time=9&startdate=1%2F4%2F1999&enddate=7%2F2%2F2011&freq=2&compidx=aaaaa%3A0&comptemptext=&comp=none&ma=0&maval=9&uf=0&lf=32&lf2=4&lf3=1&type=2&style=320&size=2&timeFrameToggle=false&compareToToggle=false&indicatorsToggle=false&chartStyleToggle=false&state=10
14) http://bigcharts.marketwatch.com/advchart/frames/frames.asp?show=&insttype=Stock&symb=HEMP&x=57&y=11&time=11&startdate=1%2F4%2F1999&enddate=7%2F2%2F2011&freq=2&compidx=aaaaa%3A0&comptemptext=&comp=none&ma=0&maval=9&uf=0&lf=32&lf2=4&lf3=1&type=2&style=320&size=2&timeFrameToggle=false&compareToToggle=false&indicatorsToggle=false&chartStyleToggle=false&state=10
15) http://bigcharts.marketwatch.com/advchart/frames/frames.asp?show=&insttype=Stock&symb=ASTI&time=10&startdate=1%2F4%2F1999&enddate=7%2F2%2F2011&freq=2&compidx=aaaaa%3A0&comptemptext=&comp=none&ma=0&maval=9&uf=0&lf=32&lf2=4&lf3=1&type=2&style=320&size=2&timeFrameToggle=false&compareToToggle=false&indicatorsToggle=false&chartStyleToggle=false&state=10&x=51&y=10
16) http://bigcharts.marketwatch.com/advchart/frames/frames.asp?show=&insttype=&symb=IFUS&x=0&y=0&time=12&startdate=1%2F4%2F1999&enddate=7%2F2%2F2011&freq=3&compidx=aaaaa%3A0&comptemptext=&comp=none&ma=0&maval=9&uf=0&lf=32&lf2=4&lf3=1&type=2&style=320&size=2&timeFrameToggle=false&compareToToggle=false&indicatorsToggle=false&chartStyleToggle=false&state=10
Bullish and Bearish Head-And-Shoulder patterns:
https://c.mql5.com/6/8/hhhh.jpg

QTMM monthly 2yr
http://bigcharts.marketwatch.com/kaavio.Webhost/charts/big.chart?nosettings=1&symb=QTMM&uf=0&type=2&size=2&sid=4700466&style=320&freq=3&entitlementtoken=0c33378313484ba9b46b8e24ded87dd6&time=9&rand=15852149&compidx=aaaaa%3a0&ma=0&maval=9&lf=32&lf2=4&lf3=2&height=553&width=579&mocktick=1

QTMM stands out among the crowd with an extremely bullish chart pattern:
1) http://bigcharts.marketwatch.com/advchart/frames/frames.asp?show=&insttype=Stock&symb=QTMM&x=48&y=12&time=9&startdate=1%2F4%2F1999&enddate=7%2F2%2F2011&freq=2&compidx=aaaaa%3A0&comptemptext=&comp=none&ma=0&maval=9&uf=0&lf=32&lf2=4&lf3=1&type=2&style=320&size=2&timeFrameToggle=false&compareToToggle=false&indicatorsToggle=false&chartStyleToggle=false&state=10
2) http://bigcharts.marketwatch.com/advchart/frames/frames.asp?show=&insttype=&symb=CCLX&x=0&y=0&time=9&startdate=1%2F4%2F1999&enddate=7%2F2%2F2011&freq=2&compidx=aaaaa%3A0&comptemptext=&comp=none&ma=0&maval=9&uf=0&lf=32&lf2=4&lf3=1&type=2&style=320&size=2&timeFrameToggle=false&compareToToggle=false&indicatorsToggle=false&chartStyleToggle=false&state=10
3) http://bigcharts.marketwatch.com/advchart/frames/frames.asp?show=&insttype=&symb=GNOW&x=0&y=0&time=9&startdate=1%2F4%2F1999&enddate=7%2F2%2F2011&freq=2&compidx=aaaaa%3A0&comptemptext=&comp=none&ma=0&maval=9&uf=0&lf=32&lf2=4&lf3=1&type=2&style=320&size=2&timeFrameToggle=false&compareToToggle=false&indicatorsToggle=false&chartStyleToggle=false&state=10
4) http://bigcharts.marketwatch.com/advchart/frames/frames.asp?show=&insttype=&symb=LNCLF&x=0&y=0&time=9&startdate=1%2F4%2F1999&enddate=7%2F2%2F2011&freq=2&compidx=aaaaa%3A0&comptemptext=&comp=none&ma=0&maval=9&uf=0&lf=32&lf2=4&lf3=1&type=2&style=320&size=2&timeFrameToggle=false&compareToToggle=false&indicatorsToggle=false&chartStyleToggle=false&state=10
There was chart in March but not anymore, looks like this one has gone out of business
5) http://bigcharts.marketwatch.com/advchart/frames/frames.asp?show=&insttype=&symb=ZNGY&x=0&y=0&time=9&startdate=1%2F4%2F1999&enddate=7%2F2%2F2011&freq=2&compidx=aaaaa%3A0&comptemptext=&comp=none&ma=0&maval=9&uf=0&lf=32&lf2=4&lf3=1&type=2&style=320&size=2&timeFrameToggle=false&compareToToggle=false&indicatorsToggle=false&chartStyleToggle=false&state=10
Share price reflects numerous Reverse split
6) http://bigcharts.marketwatch.com/advchart/frames/frames.asp?show=&insttype=&symb=PSON&x=0&y=0&time=9&startdate=1%2F4%2F1999&enddate=7%2F2%2F2011&freq=2&compidx=aaaaa%3A0&comptemptext=&comp=none&ma=0&maval=9&uf=0&lf=32&lf2=4&lf3=1&type=2&style=320&size=2&timeFrameToggle=false&compareToToggle=false&indicatorsToggle=false&chartStyleToggle=false&state=10
7) http://bigcharts.marketwatch.com/advchart/frames/frames.asp?show=&insttype=&symb=FPVD&x=0&y=0&time=9&startdate=1%2F4%2F1999&enddate=7%2F2%2F2011&freq=2&compidx=aaaaa%3A0&comptemptext=&comp=none&ma=0&maval=9&uf=0&lf=32&lf2=4&lf3=1&type=2&style=320&size=2&timeFrameToggle=false&compareToToggle=false&indicatorsToggle=false&chartStyleToggle=false&state=10
8) http://bigcharts.marketwatch.com/advchart/frames/frames.asp?show=&insttype=&symb=AEXE&x=0&y=0&time=9&startdate=1%2F4%2F1999&enddate=7%2F2%2F2011&freq=2&compidx=aaaaa%3A0&comptemptext=&comp=none&ma=0&maval=9&uf=0&lf=32&lf2=4&lf3=1&type=2&style=320&size=2&timeFrameToggle=false&compareToToggle=false&indicatorsToggle=false&chartStyleToggle=false&state=10
9) http://bigcharts.marketwatch.com/advchart/frames/frames.asp?show=&insttype=&symb=BONTQ&x=0&y=0&time=9&startdate=1%2F4%2F1999&enddate=7%2F2%2F2011&freq=2&compidx=aaaaa%3A0&comptemptext=&comp=none&ma=0&maval=9&uf=0&lf=32&lf2=4&lf3=1&type=2&style=320&size=2&timeFrameToggle=false&compareToToggle=false&indicatorsToggle=false&chartStyleToggle=false&state=10
10) http://bigcharts.marketwatch.com/advchart/frames/frames.asp?show=&insttype=&symb=RIHT&x=0&y=0&time=9&startdate=1%2F4%2F1999&enddate=7%2F2%2F2011&freq=2&compidx=aaaaa%3A0&comptemptext=&comp=none&ma=0&maval=9&uf=0&lf=32&lf2=4&lf3=1&type=2&style=320&size=2&timeFrameToggle=false&compareToToggle=false&indicatorsToggle=false&chartStyleToggle=false&state=10
11) http://bigcharts.marketwatch.com/advchart/frames/frames.asp?show=&insttype=&symb=SNPW&x=53&y=11&time=9&startdate=1%2F4%2F1999&enddate=7%2F2%2F2011&freq=2&compidx=aaaaa%3A0&comptemptext=&comp=none&ma=0&maval=9&uf=0&lf=32&lf2=4&lf3=1&type=2&style=320&size=2&timeFrameToggle=false&compareToToggle=false&indicatorsToggle=false&chartStyleToggle=false&state=10
12) http://bigcharts.marketwatch.com/advchart/frames/frames.asp?show=&insttype=&symb=CBBT&x=0&y=0&time=9&startdate=1%2F4%2F1999&enddate=7%2F2%2F2011&freq=2&compidx=aaaaa%3A0&comptemptext=&comp=none&ma=0&maval=9&uf=0&lf=32&lf2=4&lf3=1&type=2&style=320&size=2&timeFrameToggle=false&compareToToggle=false&indicatorsToggle=false&chartStyleToggle=false&state=10
13) http://bigcharts.marketwatch.com/advchart/frames/frames.asp?show=&insttype=&symb=ABCE&x=0&y=0&time=9&startdate=1%2F4%2F1999&enddate=7%2F2%2F2011&freq=2&compidx=aaaaa%3A0&comptemptext=&comp=none&ma=0&maval=9&uf=0&lf=32&lf2=4&lf3=1&type=2&style=320&size=2&timeFrameToggle=false&compareToToggle=false&indicatorsToggle=false&chartStyleToggle=false&state=10
14) http://bigcharts.marketwatch.com/advchart/frames/frames.asp?show=&insttype=Stock&symb=HEMP&x=57&y=11&time=11&startdate=1%2F4%2F1999&enddate=7%2F2%2F2011&freq=2&compidx=aaaaa%3A0&comptemptext=&comp=none&ma=0&maval=9&uf=0&lf=32&lf2=4&lf3=1&type=2&style=320&size=2&timeFrameToggle=false&compareToToggle=false&indicatorsToggle=false&chartStyleToggle=false&state=10
15) http://bigcharts.marketwatch.com/advchart/frames/frames.asp?show=&insttype=Stock&symb=ASTI&time=10&startdate=1%2F4%2F1999&enddate=7%2F2%2F2011&freq=2&compidx=aaaaa%3A0&comptemptext=&comp=none&ma=0&maval=9&uf=0&lf=32&lf2=4&lf3=1&type=2&style=320&size=2&timeFrameToggle=false&compareToToggle=false&indicatorsToggle=false&chartStyleToggle=false&state=10&x=51&y=10
16) http://bigcharts.marketwatch.com/advchart/frames/frames.asp?show=&insttype=&symb=IFUS&x=0&y=0&time=12&startdate=1%2F4%2F1999&enddate=7%2F2%2F2011&freq=3&compidx=aaaaa%3A0&comptemptext=&comp=none&ma=0&maval=9&uf=0&lf=32&lf2=4&lf3=1&type=2&style=320&size=2&timeFrameToggle=false&compareToToggle=false&indicatorsToggle=false&chartStyleToggle=false&state=10
Join the InvestorsHub Community
Register for free to join our community of investors and share your ideas. You will also get access to streaming quotes, interactive charts, trades, portfolio, live options flow and more tools.

