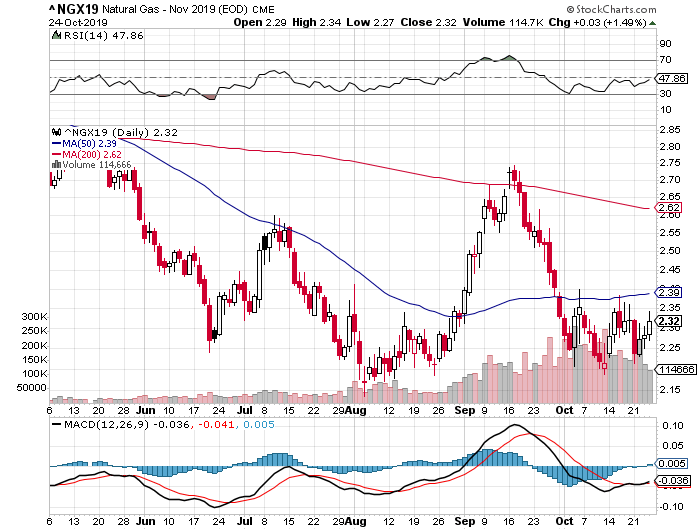
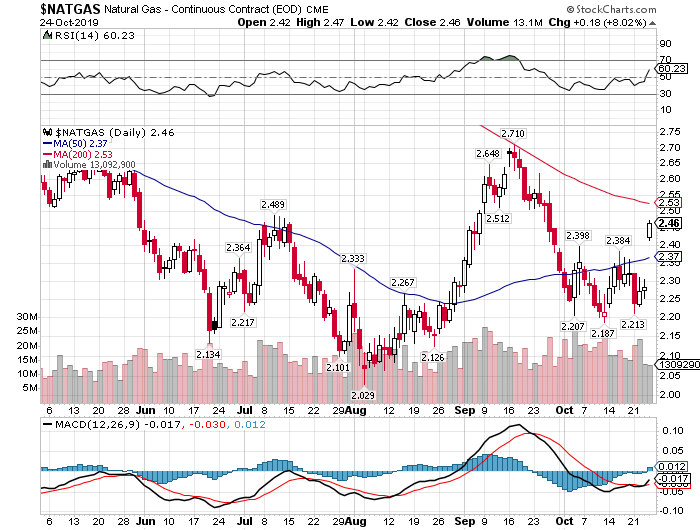
Stockchart rolls the NG chart at the EOD when the frt month vol decreases below the fwd month that happened today.
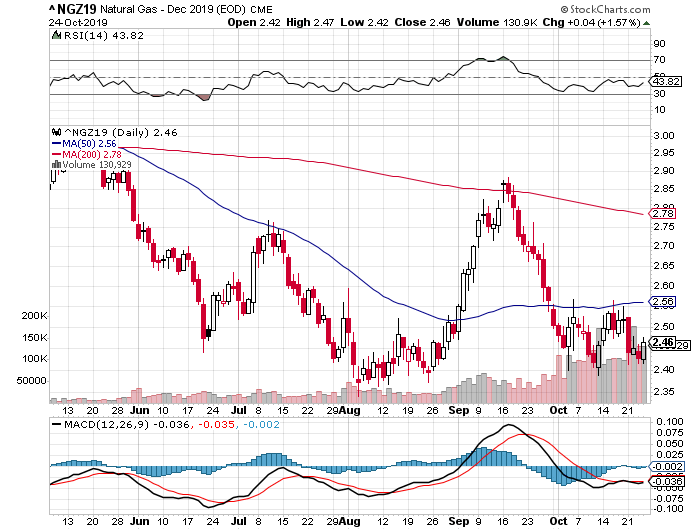
NG chart shows a 8% gain .12 gap up. At first glance this looks like a huge breakout above the 50ma for NG. FX empire even wrote did an article to that affect today complete with video review. Yet Nov and Dec both have been struggling/basing below the 50ma for weeks. Today nov/dec were up about 1.5%
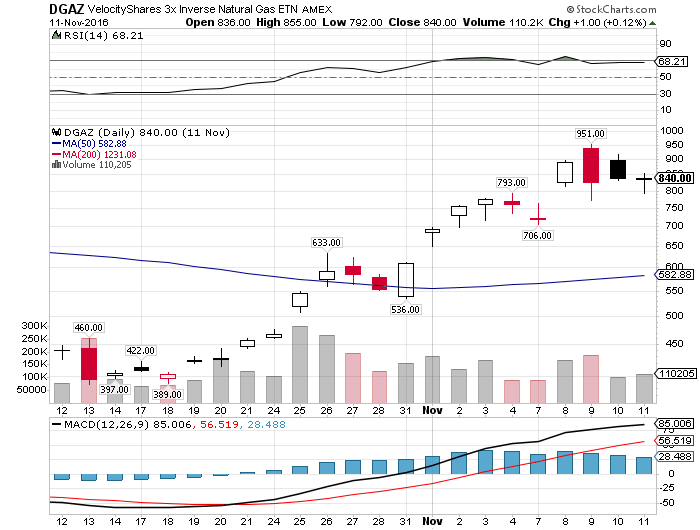
To see how this might play out we go look at similar situations when there was Contango during the chart/contract roll 2016 oct/nov is a good example
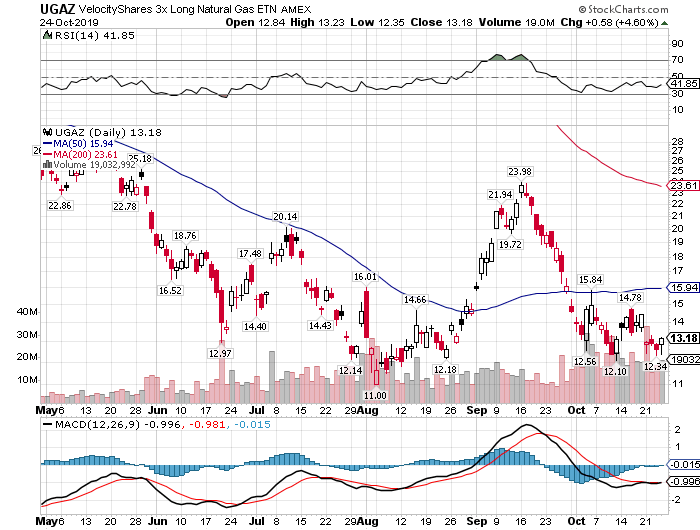
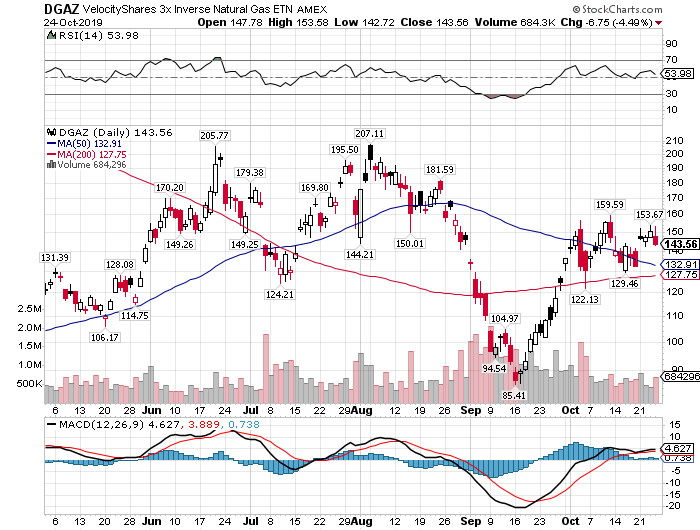
Initially there was a slight bump Thursday Friday then Monday gap n trap selloff then that week the gap up was fully closed. Any move down into the Contango gap results in a decrease in the value of UGAZ and increase in DGAZ. NG goes back to where it was before the roll. Ask yourself will NG go back and at least test the 50ma for support. The same 50ma it has been struggling to get up above.
Register for free to join our community of investors and share your ideas. You will also get access to streaming quotes, interactive charts, trades, portfolio, live options flow and more tools.


 News
News  Market Data
  Discover