Short-Term Indicators Behave Differently in Bull and Bear Markets By: Martin Pring | October 11, 2019
* (Click Read Full Story »»» at the bottom of the page for the charts to appear on the post)
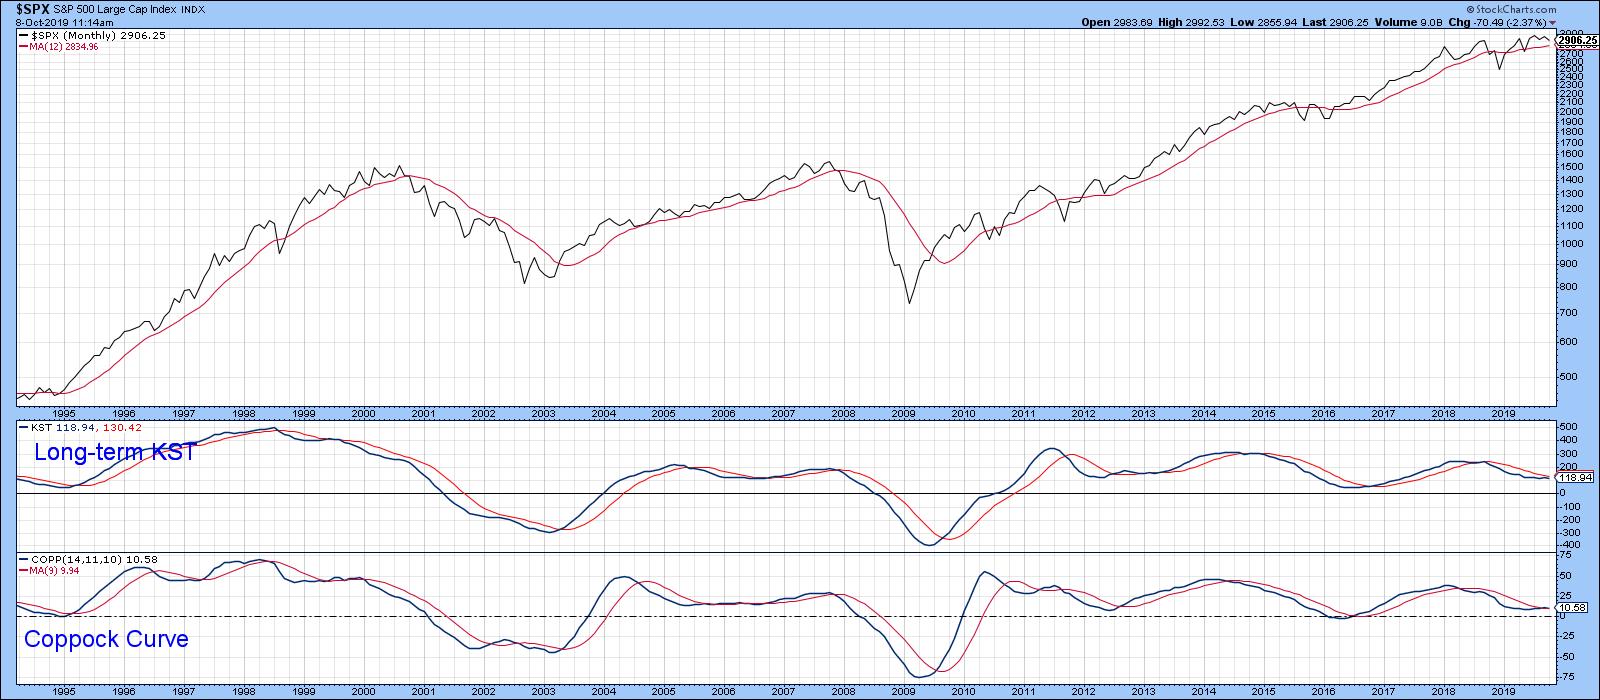
Short-term oscillators behave differently depending on the direction of the primary trend. In bull markets, prices are very sensitive to oversold conditions and quickly bounce. We see the opposite in bear markets, whereby overstretched readings on the downside do not have anywhere near the generative power they would in a bull trend. I bring this up because the majority of the long-term indicators I follow remain in the bullish camp. Take Chart 1, for instance, which shows that the S&P is above its 12-month MA and that the two momentum indicators are also in a positive trajectory. None of these series are in what we might call a decisively positive mode, so a complacently bullish stance is uncalled for, especially as the three charts I wrote about last month failed to break out on the upside. Nonetheless, the evidence, as I see it, remains bullish until proven otherwise. That means that we should expect to see the market respond to oversold short-term indicators in a positive way.
Chart 1
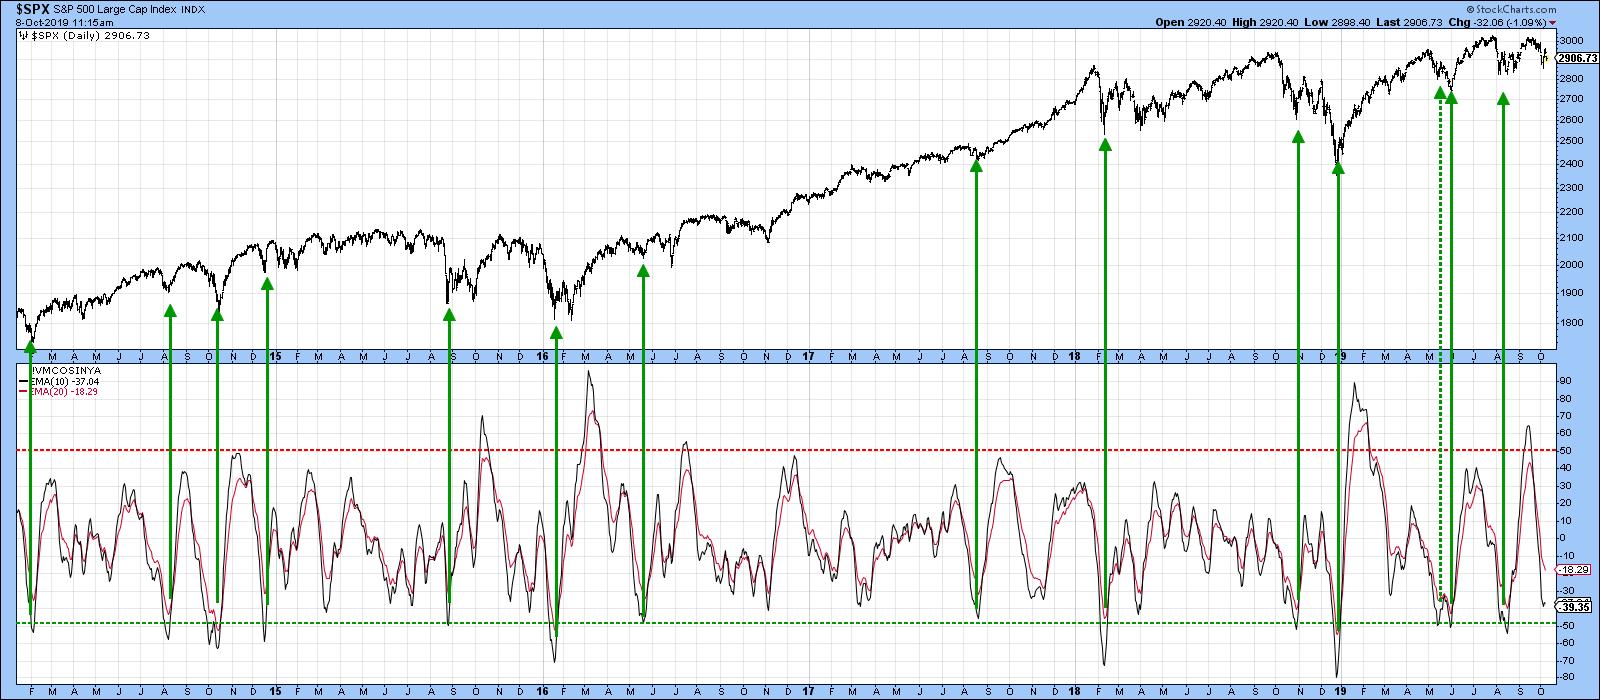
In this respect, Chart 2 features a 10-day EMA for the McClellan Volume Oscillator based on S&P components. The green arrows show when this series reverses to the upside from a position at or below the -50% level. Generally speaking, the S&P was very responsive to such conditions. One exception developed in October 2018, when all that followed was a 2-3-month trading range. Another challenged signal developed earlier this year at the dashed arrow. A reversal does not necessarily mean that prices will immediately take off on the upside, though that is often the case. What it often does, though, is signal that the market is tired of going down and probably needs a week or two to stabilize before moving higher. Currently, the oscillator is close to the oversold condition. Working on the assumption that the bull market is still alive, that probably means some range-bound activity, or even a probing of last week’s low. If a contained correction does materialize and long-term sell signals are avoided, that would be very positive. Firstly, it would indicate that the bull market is still with us. Second, once October is out of the way, the market enters the seasonally bullish November/April period, not to mention the upcoming bullish fourth quarter of the pre-election year and a bullish fourth year of the Presidential Cycle.
Chart 2
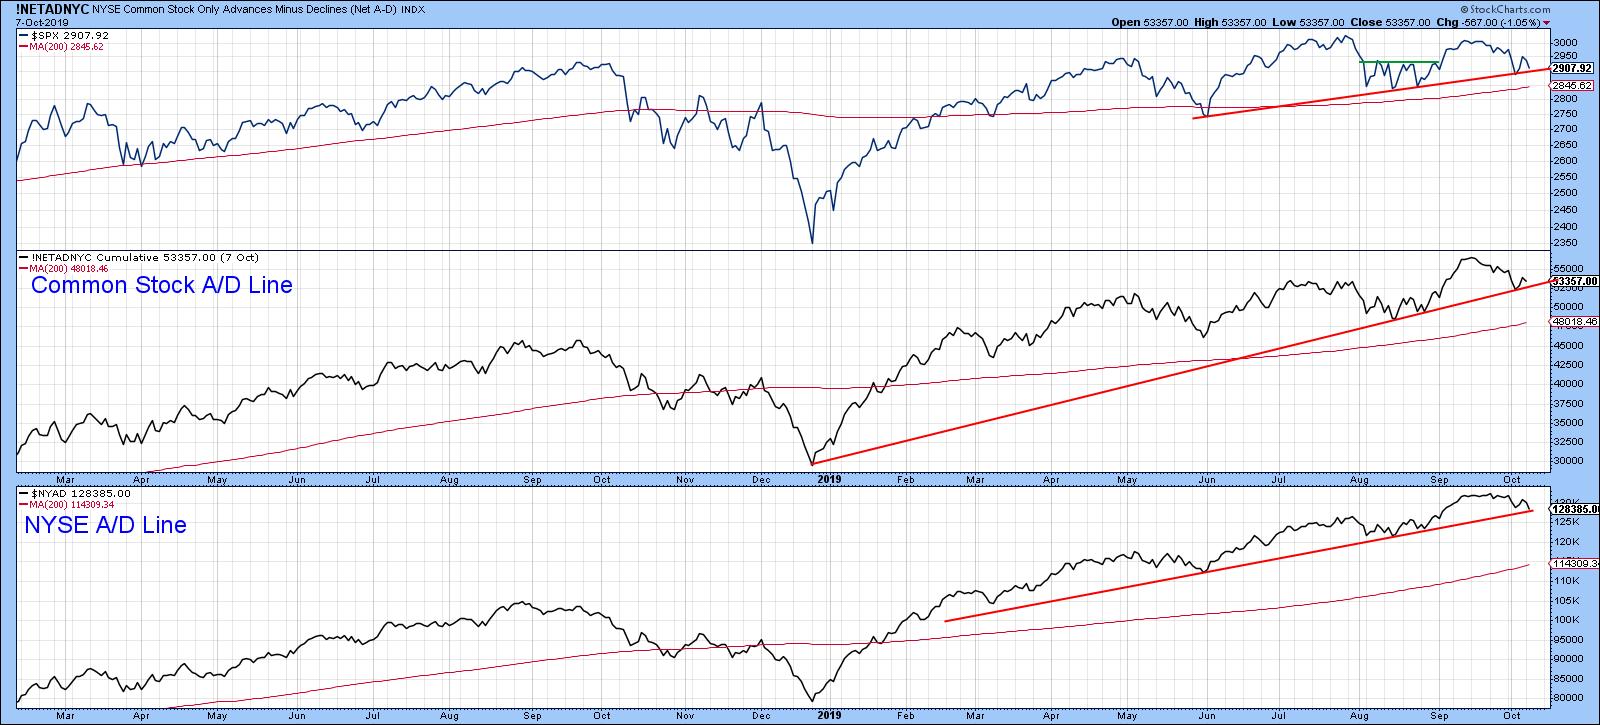
The stakes are high, as both the NYSE Common Stock A/D Line and its more broadly based counterpart in Chart 3 are very close to rupturing some important uptrend lines. The S&P is similarly positioned. Their violation would not signify a bear market, but, given the narrow margin between the S&P and its 12-month MA, it's possible that such weak action could eventually feed back to tip the primary trend balance to the bearish side.
Chart 3
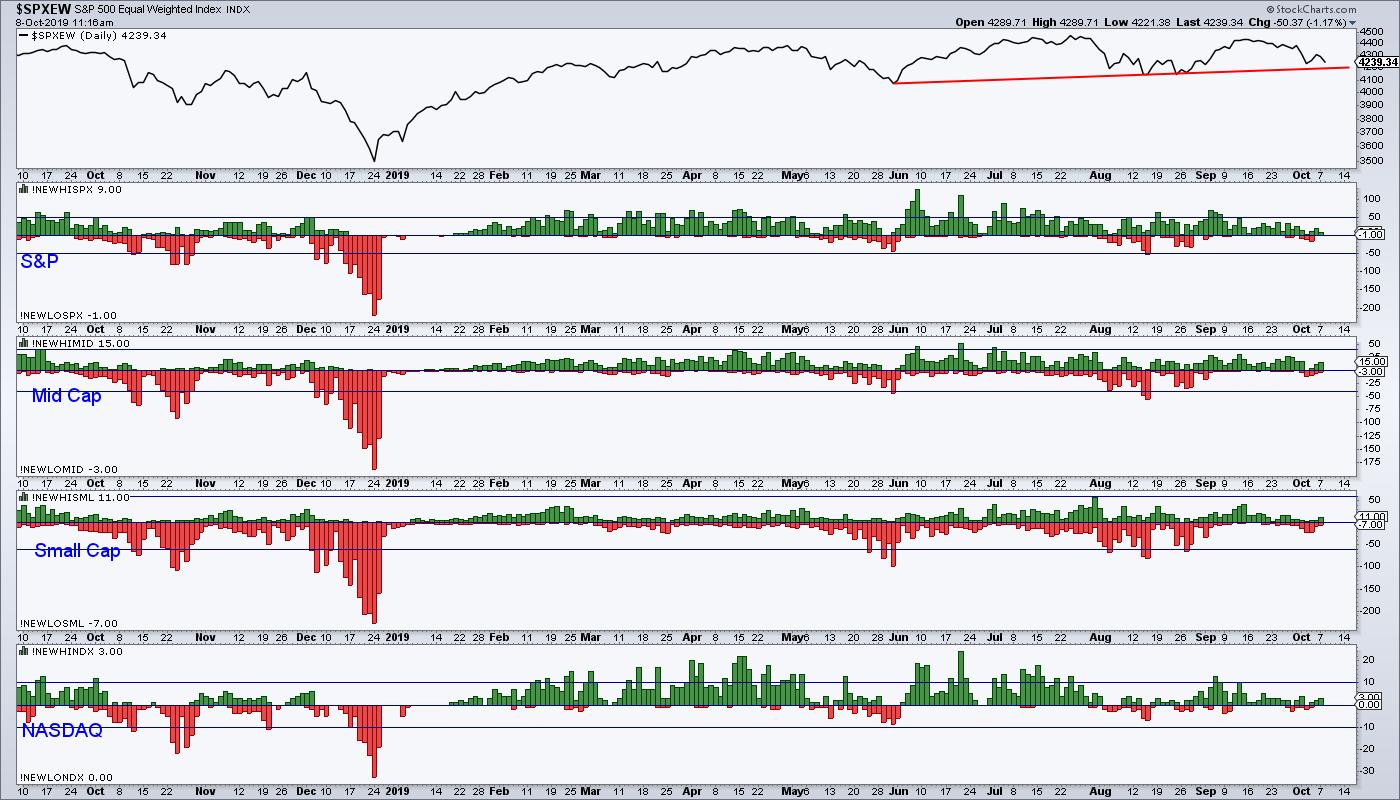
One set of indicators that often warn of subtle underlying strength or weakness are those based on net new data, featured in Chart 4 for several market sectors. Note that all series recently sported a small number of new highs and no new lows. This compares to last week, when each sector experienced a smattering of new lows, highlighted in red. This discrepancy could easily be cleared up, but, at the moment, new high data is a positive factor.
Information posted to this board is not meant to suggest any specific action, but to point out the technical signs that can help our readers make their own specific decisions. Your Due Dilegence is a must! • DiscoverGold
Register for free to join our community of investors and share your ideas. You will also get access to streaming quotes, interactive charts, trades, portfolio, live options flow and more tools.


 News
News  Market Data
  Discover