DP (SPY) WEEKLY WRAP: "Golden Cross" Index Generates SELL Signal By: Carl Swenlin | May 24, 2019
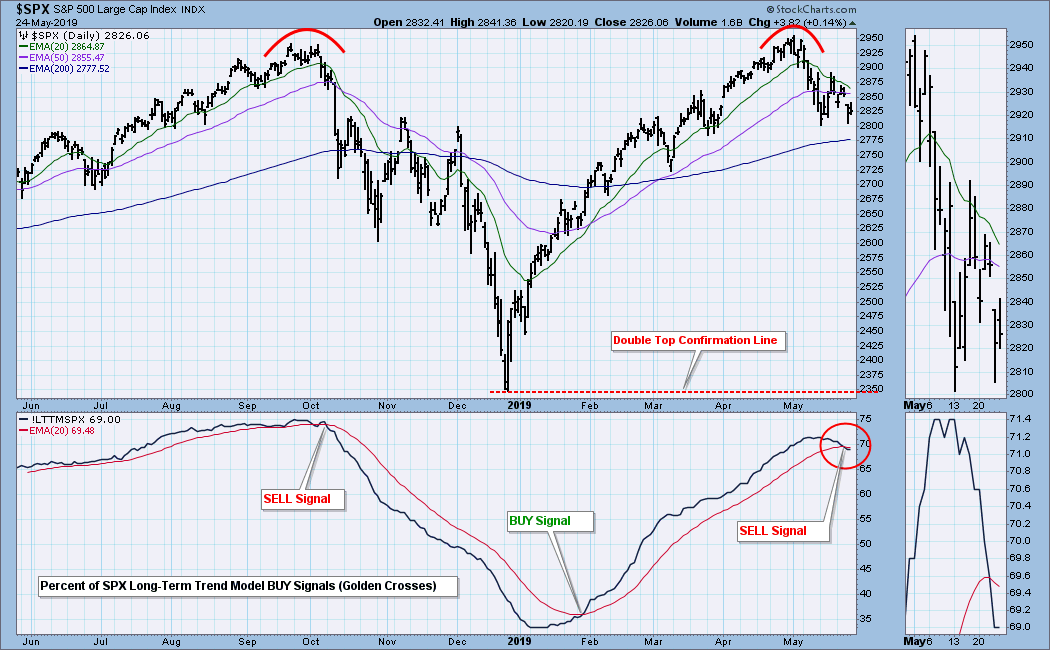
When the 50EMA crosses up through the 200EMA, it is commonly known as a "Golden Cross," because it signals the potential for a long-term bullish outcome. For the sake of consistency, in DecisionPoint parlance we refer to the 50/200EMA relationship as the Long-Term Trend Model (LTTM), which generates BUY or SELL signals when the 50EMA moves above or below the 200EMA. About a year ago I began collecting data on the percentage of LTTM BUY Signals among S&P 500 component stocks. The chart below shows the SPX LTTM index, and a 20EMA serves as the index signal line. Note that this week the SPX LTTM Index crossed down through its signal line, generating a long-term SELL signal for this indicator.
I should emphasize that this is intended to be a long-term indicator, but one year of data is not sufficient to evaluate how it will behave over the long term.
GLOBAL MARKETS
BROAD MARKET INDEXES
SECTORS
Each S&P 500 Index component stock is assigned to one, and only one, of 11 major sectors. This is a snapshot of the Intermediate-Term and Long-Term Trend Model signal status for those sectors.
STOCKS
IT Trend Model: BUY as of 2/1/2019
LT Trend Model: BUY as of 2/26/2019
SPY Daily Chart: I'm still pushing the double top theme in spite of the recent bounce, during which the daily PMO continued its decline. S&P 500 total volume has been weak on up days. And the VIX overbought level currently seems to be at the 20SMA rather than the top Bollinger Band. The most encouraging thing on this chart is the potential short-term double bottom.
SPY Weekly Chart: The weekly PMO has topped, which is an indication of lower prices to follow.
Climactic Market Indicators: There were climactic readings on Tuesday (upside exhaustion) and Thursday (downside exhaustion), and neither proved to be conclusive.
Short-Term Market Indicators: Note that the recent STO-B and STO-V tops have lowered the overbought level in the last month. The lowest recent oversold level is about -200 to -300, so I'll look for that to be challenged soon.
Intermediate-Term Market Indicators: The PMO, ITBM, and ITVM are at the zero line. In a bull market that would be oversold, but we'll have to wait and see.
CONCLUSION: It is now obvious to me (and probably most people) that a trade agreement with the Chinese will not be reached, and that North Korea will not denuclearize. Both countries, totalitarian governments, have been simply running out the clock. From the beginning I thought this might be where the negotiations were headed, but I also hoped that maybe this time would be different. Well, it's not, and the market doesn't like it. There are lots of doomsday scenarios out there, but at this point I don't think that anyone knows how the tariff thing is going to work out. We'll see.
The technical picture is not good, particularly with the dreary fundamental backdrop. First there is the SELL signal covered in the lead paragraph. Even without deep historical data for comparison, it looks pretty solid. The intermediate-term indicators in the chart immediately above are not the least bit oversold, and they can accommodate a continued price decline. As usual, we cannot see the future, but the current technicals are pointing toward less favorable outcomes...
Information posted to this board is not meant to suggest any specific action, but to point out the technical signs that can help our readers make their own specific decisions. Your Due Dilegence is a must! • DiscoverGold
Register for free to join our community of investors and share your ideas. You will also get access to streaming quotes, interactive charts, trades, portfolio, live options flow and more tools.


 News
News  Market Data
  Discover