DP (SPY) WEEKLY WRAP: Double Top Scenario Still Fits By: Carl Swenlin | May 17, 2019
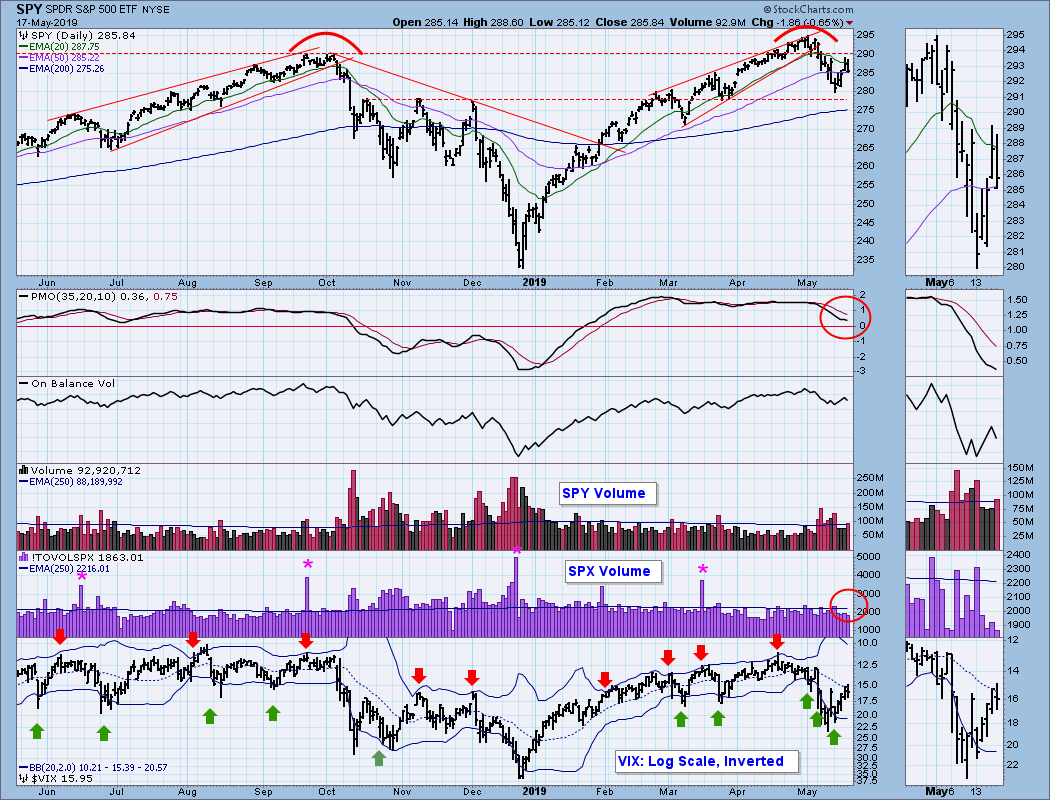
Last week I asserted that the market was in the process of forming a major double top. This week, in spite of some price action attempting to refute that assertion, the double top is still evolving. So far the rally attempt appears to have failed, and the thin volume says that there is not as much conviction behind the rally as there ought to be. Specifically, I am referring to the SPX Volume panel below. Note that there was a high volume day on Monday's decline, but volume for the rest of the week was well below the one-year average of volume.
GLOBAL MARKETS
BROAD MARKET INDEXES
SECTORS
Each S&P 500 Index component stock is assigned to one, and only one, of 11 major sectors. This is a snapshot of the Intermediate-Term and Long-Term Trend Model signal status for those sectors.
STOCKS
IT Trend Model: BUY as of 2/1/2019
LT Trend Model: BUY as of 2/26/2019
SPY Daily Chart: This week's options expiration was not an end-of-quarter expiration, so total SPX volume was not distorted. (I have highlighted EOQ volume with a pink asterisk.) Note that this week's price bounce was stopped by a short-term declining tops line, as well as short-term horizontal resistance. The daily PMO tried to bottom on Thursday and Friday, but was still falling at each day's close.
SPY Weekly Chart: A month ago SPY had recaptured the previous cyclical bull market rising trend line, but at this point I think the line is more or less irrelevant. That line was violated by a short cyclical bear market that ended in December. Since then a steep advance of nearly +27% established a new cyclical bull market. Since the top of three weeks ago, some corrective action has taken place, but the weekly PMO topped, and there is probably more downside ahead.
Climactic Market Indicators: The VIX managed to move up to its 20-day simple moving average, which may signal the upper limit of the price move.
Short-Term Market Indicators: The STO-B and STO-V have topped very near the zero line -- plenty of room to go either way.
Intermediate-Term Market Indicators: The short rally this week caused some ripples in the ITBM, ITVM, and SPX BPI. They are near the zero line, leaving plenty of room to go lower.
CONCLUSION: On Monday there was follow through from the prior week's decline, but then prices bounced, hinting that maybe the decline was over; however, by the end of the week the SPY weekly PMO topped, and I give that a lot of weight. On the chart immediately above, the PMO, ITBM, and ITVM have only reached neutral, and I think that there will be more to this decline...
Information posted to this board is not meant to suggest any specific action, but to point out the technical signs that can help our readers make their own specific decisions. Your Due Dilegence is a must! • DiscoverGold
Register for free to join our community of investors and share your ideas. You will also get access to streaming quotes, interactive charts, trades, portfolio, live options flow and more tools.


 News
News  Market Data
  Discover