


| Followers | 689 |
| Posts | 143817 |
| Boards Moderated | 35 |
| Alias Born | 03/10/2004 |
Friday, May 17, 2019 8:28:58 AM
On the Fickle Correlation Between Stocks and Oil Prices
By: Tom McClellan | May 16, 2019
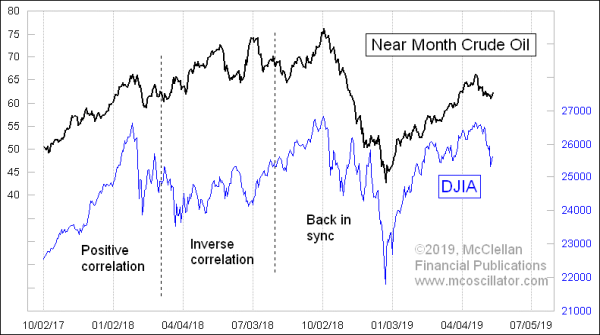
The sharp decline in crude oil prices in Q4 of 2018 helped to take down the stock market in sympathy. And then the rapid rebound by oil has coincided with a robust rebound in stock prices, with strong breadth numbers to help confirm the stock market’s strength in 2019. But if you think you understand the relationship between stock prices and oil prices, then you have not looked at enough data yet.
Oil and stocks have been in a strong positive correlation since around the beginning of August 2018. But for the 5 months prior to that start point, they were in an inverse correlation. And they were in a positive correlation leading up to March 2018. That is why I refer to it as a fickle relationship.
I can construct reasonable arguments for both relationships. It makes sense in one respect that there should be an inverse relationship. After all, higher oil prices are inflationary, and that could lead the Federal Reserve to hike short term interest rates, potentially harming the stock market. Higher oil prices also impact the corporate earnings of companies which use petroleum products to make or ship things (although having higher oil prices helps the companies selling the oil). High prices for oil leads to higher gasoline prices, which impacts the consumer’s ability to spend money on other things.
A positive correlation makes sense when we realize that a lot of the high-yield debt out there has been issued by oil drillers and others in that industry, who might have trouble if oil prices fall too much. Low oil could endanger those companies’ ability to make debt payments, which could lead to defaults, harming the banking sector, and soaking up liquidity which might be otherwise available to lift stock prices.
Both of these arguments are good arguments, and each is valid at different times. The curious point about this relationship is that these two conflicting arguments do not seem to operate much together. Investors cling to one argument sometimes, and the other at other times. I have yet to figure out what factor cause that switch to flip, and to change the correlation from positive to inverse, and back again. It seems to happen every few months, but the durations of positive and inverse correlation periods are highly variable, so as far as I can tell there is not a consistent time cycle driving those changes.
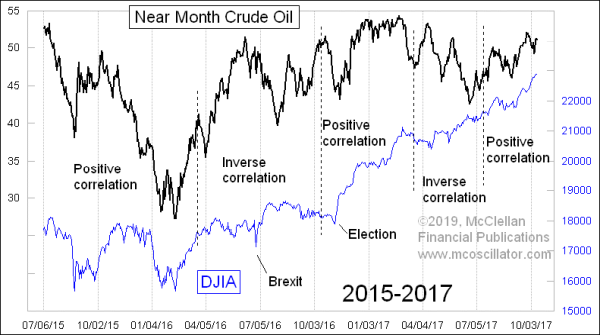
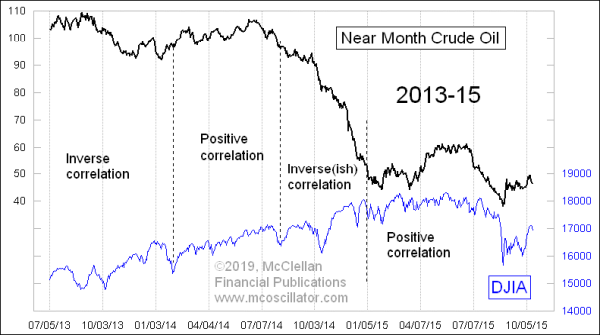
The alternating correlation is not a new phenomenon. It has been going on for many years. Here are a couple of charts showing periods farther back in time:
At the moment, the relationship between crude oil prices and the DJIA appears to be a positive one. But it has been positive for a long time now, so that might mean it is due for a flip. How to detect that change in real time is a difficult problem. A lot of analysts like to use Pearson’s Correlation Coefficient to track the correlations of various sets of data, even though that is the wrong statistical tool for time series data. Pearson’s is great if you want to correlate something in a population study, like the height and weight of individuals in a group, for example. But time series data creates problems for Pearson’s, because trends can skew the numbers.
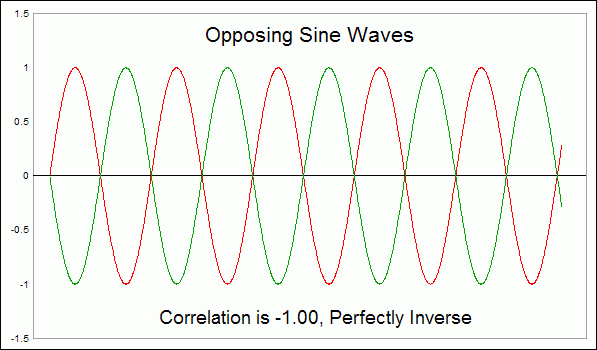
Here is an example from an August 2010 Chart In Focus article:
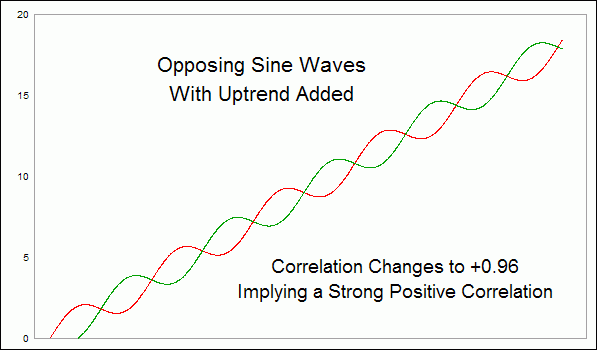
There are better statistical tools for gauging the relationships between time series data, but they are harder to use, whereas Pearson’s Correlation Coefficient can be summoned with just a few keystrokes in any spreadsheet program. Easy to use does not always mean good to use.
That’s why I rely on visual analysis, even though I know that my own eye can be fallible. And I strive to remember that what I think the relationship is at any moment could start to change without notice.
Tom McClellan
Editor, The McClellan Market Report
Read Full Story »»»
• DiscoverGold
Click on "In reply to", for Authors past commentaries
By: Tom McClellan | May 16, 2019

The sharp decline in crude oil prices in Q4 of 2018 helped to take down the stock market in sympathy. And then the rapid rebound by oil has coincided with a robust rebound in stock prices, with strong breadth numbers to help confirm the stock market’s strength in 2019. But if you think you understand the relationship between stock prices and oil prices, then you have not looked at enough data yet.
Oil and stocks have been in a strong positive correlation since around the beginning of August 2018. But for the 5 months prior to that start point, they were in an inverse correlation. And they were in a positive correlation leading up to March 2018. That is why I refer to it as a fickle relationship.
I can construct reasonable arguments for both relationships. It makes sense in one respect that there should be an inverse relationship. After all, higher oil prices are inflationary, and that could lead the Federal Reserve to hike short term interest rates, potentially harming the stock market. Higher oil prices also impact the corporate earnings of companies which use petroleum products to make or ship things (although having higher oil prices helps the companies selling the oil). High prices for oil leads to higher gasoline prices, which impacts the consumer’s ability to spend money on other things.
A positive correlation makes sense when we realize that a lot of the high-yield debt out there has been issued by oil drillers and others in that industry, who might have trouble if oil prices fall too much. Low oil could endanger those companies’ ability to make debt payments, which could lead to defaults, harming the banking sector, and soaking up liquidity which might be otherwise available to lift stock prices.
Both of these arguments are good arguments, and each is valid at different times. The curious point about this relationship is that these two conflicting arguments do not seem to operate much together. Investors cling to one argument sometimes, and the other at other times. I have yet to figure out what factor cause that switch to flip, and to change the correlation from positive to inverse, and back again. It seems to happen every few months, but the durations of positive and inverse correlation periods are highly variable, so as far as I can tell there is not a consistent time cycle driving those changes.
The alternating correlation is not a new phenomenon. It has been going on for many years. Here are a couple of charts showing periods farther back in time:


At the moment, the relationship between crude oil prices and the DJIA appears to be a positive one. But it has been positive for a long time now, so that might mean it is due for a flip. How to detect that change in real time is a difficult problem. A lot of analysts like to use Pearson’s Correlation Coefficient to track the correlations of various sets of data, even though that is the wrong statistical tool for time series data. Pearson’s is great if you want to correlate something in a population study, like the height and weight of individuals in a group, for example. But time series data creates problems for Pearson’s, because trends can skew the numbers.
Here is an example from an August 2010 Chart In Focus article:


There are better statistical tools for gauging the relationships between time series data, but they are harder to use, whereas Pearson’s Correlation Coefficient can be summoned with just a few keystrokes in any spreadsheet program. Easy to use does not always mean good to use.
That’s why I rely on visual analysis, even though I know that my own eye can be fallible. And I strive to remember that what I think the relationship is at any moment could start to change without notice.
Tom McClellan
Editor, The McClellan Market Report
Read Full Story »»»
• DiscoverGold
Click on "In reply to", for Authors past commentaries
Information posted to this board is not meant to suggest any specific action, but to point out the technical signs that can help our readers make their own specific decisions. Your Due Dilegence is a must!
• DiscoverGold
Join the InvestorsHub Community
Register for free to join our community of investors and share your ideas. You will also get access to streaming quotes, interactive charts, trades, portfolio, live options flow and more tools.

