


| Followers | 689 |
| Posts | 143817 |
| Boards Moderated | 35 |
| Alias Born | 03/10/2004 |
Wednesday, May 15, 2019 8:09:45 AM
By: Arthur Hill | May 15, 2019
General Electric (GE) is one of the worst performing stocks over the last two years, but the stock is perking up in 2019 and outperforming in May. The S&P 500 is down 3.8% so far this month and GE is up 1.5% after a big surge on Tuesday.
GE is trying to reverse the long-term downtrend with a move above its 200-day SMA over the last two weeks. The stock broke above this key moving average with a gap up on April 30th and is largely holding above the SMA. The moving average, however, is still falling.
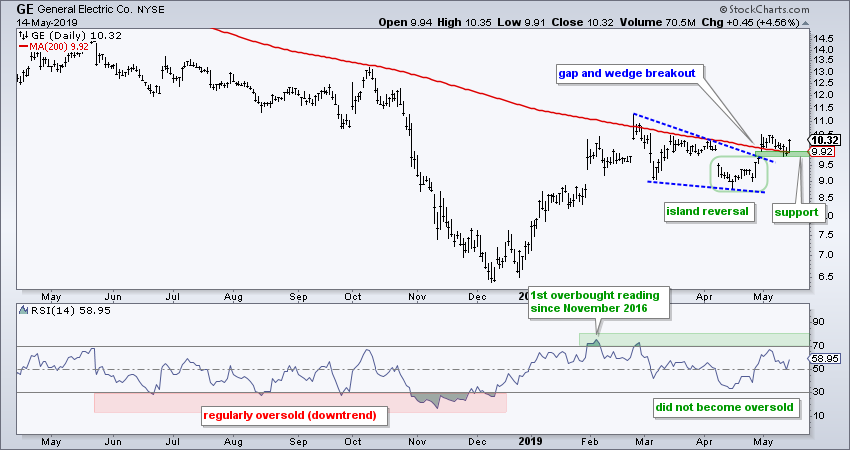
The chart sports a bullish reversal pattern and wedge breakout. First, notice the gap down in mid April and gap up in late April. These gaps overlap to create an island reversal on the chart. GE broke above the wedge line with the second gap and this gap is holding. This breakout signals a continuation of the prior advance with the gap zone now marking first support to watch going forward.
The indicator window shows RSI attempting to shift from a bearish configuration to a bullish configuration. First, notice how RSI became oversold on a regular basis as the stock trended lower. Second, note how RSI moved above 70 for the first time since November 2016. This is the most upside momentum in over two years. Third, notice that RSI did not become oversold on the April dip. Thus, we are clearly seeing more upside momentum than downside momentum this year.
Read Full Story »»»
• DiscoverGold
Information posted to this board is not meant to suggest any specific action, but to point out the technical signs that can help our readers make their own specific decisions. Your Due Dilegence is a must!
• DiscoverGold
Recent GE News
- GE Aerospace Board of Directors Authorizes Regular Quarterly Dividend • Business Wire • 09/13/2024 04:48:00 PM
- Form 4 - Statement of changes in beneficial ownership of securities • Edgar (US Regulatory) • 09/05/2024 08:26:27 PM
- Form 4 - Statement of changes in beneficial ownership of securities • Edgar (US Regulatory) • 09/04/2024 08:19:42 PM
- Form 4 - Statement of changes in beneficial ownership of securities • Edgar (US Regulatory) • 08/20/2024 08:16:14 PM
- Form 144 - Report of proposed sale of securities • Edgar (US Regulatory) • 08/14/2024 12:32:12 PM
- Form 4/A - Statement of changes in beneficial ownership of securities: [Amend] • Edgar (US Regulatory) • 08/06/2024 10:41:39 PM
- Form 4 - Statement of changes in beneficial ownership of securities • Edgar (US Regulatory) • 08/06/2024 08:09:30 PM
- Form 4 - Statement of changes in beneficial ownership of securities • Edgar (US Regulatory) • 08/06/2024 08:09:16 PM
- EVA Orders GEnx Engines to Power Boeing 787 Fleet Expansion • PR Newswire (US) • 07/24/2024 08:00:00 AM
- American Airlines Orders 180 CF34 Engines to Power New Embraer 175 Fleet • PR Newswire (US) • 07/23/2024 12:52:00 PM
- Form 10-Q - Quarterly report [Sections 13 or 15(d)] • Edgar (US Regulatory) • 07/23/2024 10:28:10 AM
- Form 8-K - Current report • Edgar (US Regulatory) • 07/23/2024 10:22:14 AM
- U.S. Index Futures Dip Slightly as Investors Await Major Earnings Reports, Oil Prices Edge Up • IH Market News • 07/23/2024 10:04:07 AM
- British Airways Orders First GEnx Engines for New 787 Dreamliners • PR Newswire (US) • 07/22/2024 04:34:00 PM
- Japan Airlines Signs Deal for GEnx to Power New 787s • PR Newswire (US) • 07/22/2024 03:50:00 PM
- GE Aerospace and Kratos Partner on Small Affordable Engines • GlobeNewswire Inc. • 07/22/2024 09:00:00 AM
- GE Aerospace and Kratos Partner on Small Affordable Engines • PR Newswire (US) • 07/22/2024 09:00:00 AM
- GE Aerospace and U.S. Department of Energy Reach Agreement to Expand Supercomputing Capability for Revolutionary New Open Fan Engine Architecture • PR Newswire (US) • 07/21/2024 05:00:00 PM
- GE Aerospace investit un milliard USD pour agrandir et moderniser ses installations MRO dans le monde entier • Business Wire • 07/19/2024 03:56:00 PM
- GE Aerospace investe un miliardo di dollari per espandere e aggiornare le strutture di manutenzione, riparazione e revisione in tutto il mondo • Business Wire • 07/19/2024 03:54:00 PM
- GE Aerospace investiert 1 Milliarde US-Dollar in die Erweiterung und Modernisierung von MRO-Einrichtungen weltweit • Business Wire • 07/19/2024 01:34:00 PM
- GE Aerospace Investing $1 Billion to Expand and Upgrade MRO Facilities Worldwide • Business Wire • 07/19/2024 11:55:00 AM
- TRIUMPH AWARDED F404 AUXILIARY GEARBOX FROM GE AEROSPACE • PR Newswire (US) • 07/17/2024 01:00:00 PM
- GE Aerospace T901 Engines Accepted by U.S. Army for UH-60 Black Hawk Flight Testing • PR Newswire (US) • 06/28/2024 12:02:00 PM
VHAI - Vocodia Partners with Leading Political Super PACs to Revolutionize Fundraising Efforts • VHAI • Sep 19, 2024 11:48 AM
Dear Cashmere Group Holding Co. AKA Swifty Global Signs Binding Letter of Intent to be Acquired by Signing Day Sports • DRCR • Sep 19, 2024 10:26 AM
HealthLynked Launches Virtual Urgent Care Through Partnership with Lyric Health. • HLYK • Sep 19, 2024 8:00 AM
Element79 Gold Corp. Appoints Kevin Arias as Advisor to the Board of Directors, Strengthening Strategic Leadership • ELMGF • Sep 18, 2024 10:29 AM
Mawson Finland Limited Further Expands the Known Mineralized Zones at Rajapalot: Palokas step-out drills 7 metres @ 9.1 g/t gold & 706 ppm cobalt • MFL • Sep 17, 2024 9:02 AM
PickleJar Announces Integration With OptCulture to Deliver Holistic Fan Experiences at Venue Point of Sale • PKLE • Sep 17, 2024 8:00 AM

