DP Alert: SPX Neutral Signal - I Spy a Bullish Falling Wedge on Gold - XLE ITTM SELL Signal By: Erin Swenlin | May 8, 2019
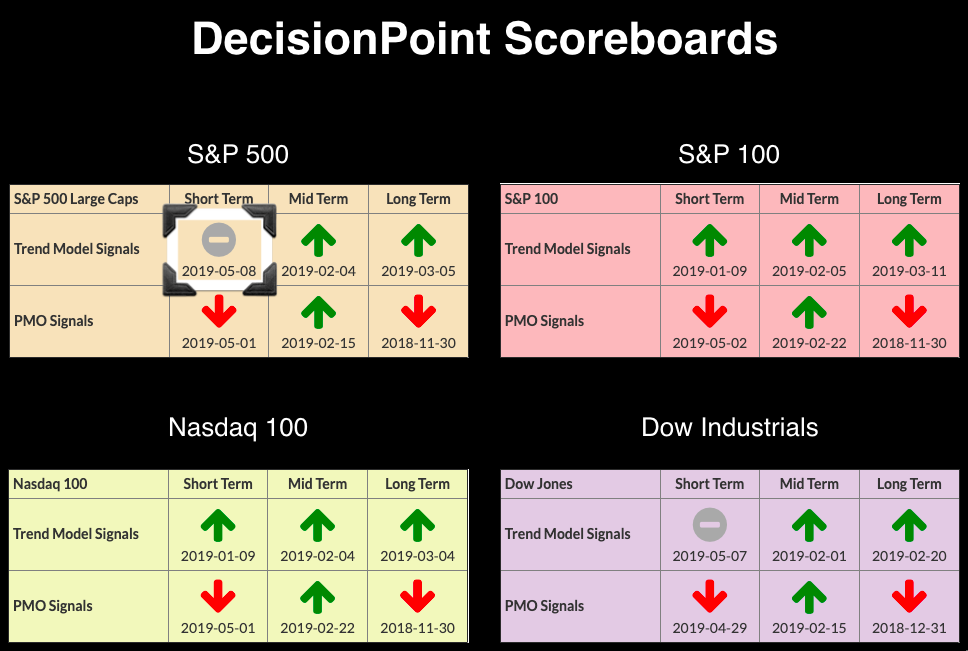
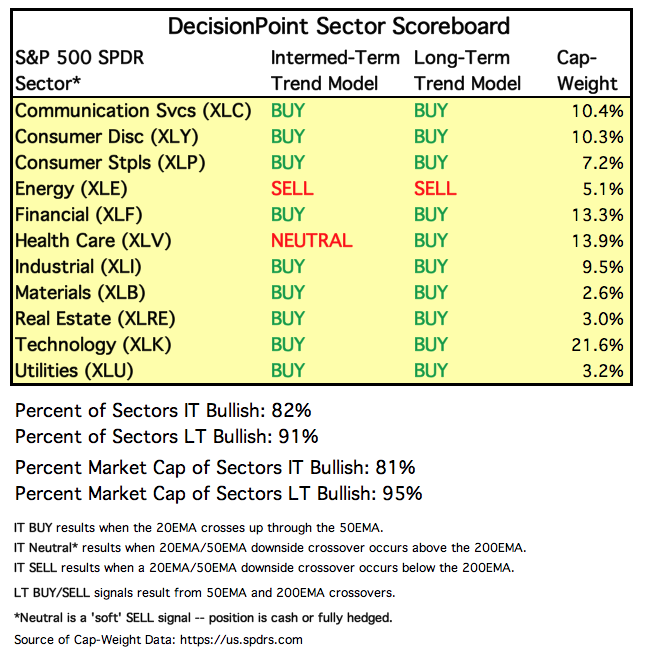
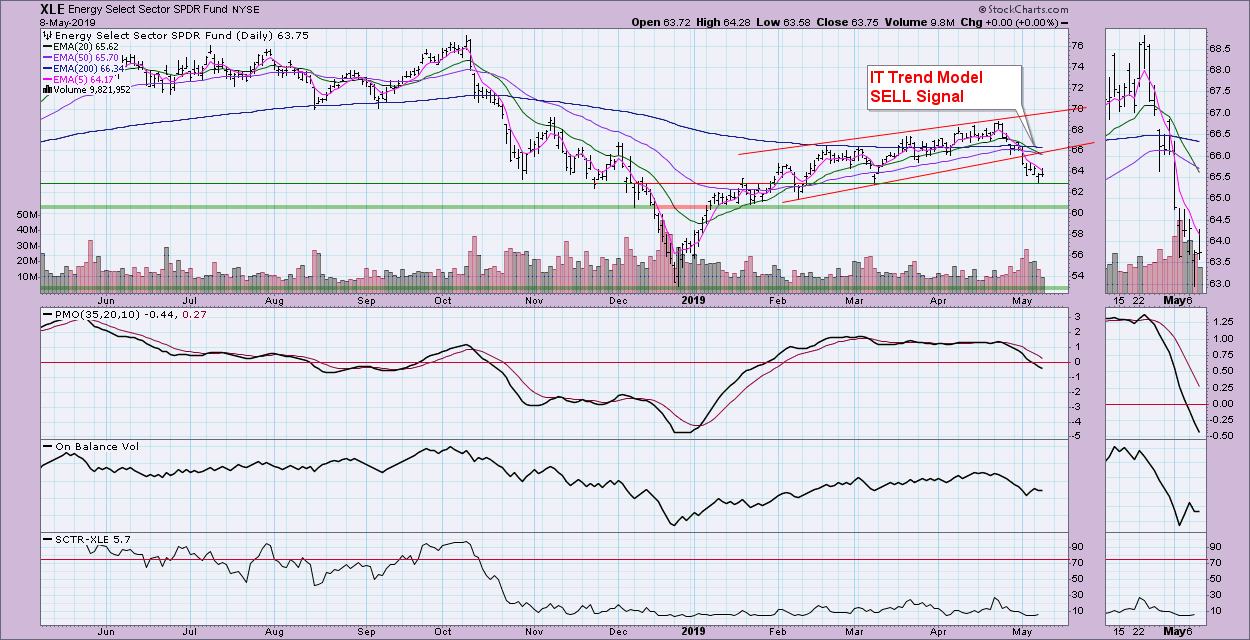
The Dow Industrials generated a ST Trend Model Neutral signal yesterday. Now, the SPX joins in with its own STTM Neutral signal. XLE triggered a new IT Trend Model SELL signal, the first to appear on the DecisionPoint Sector Scoreboard in some time. Gold may be forming a bullish declining wedge. I can still make a case for a bearish head-and-shoulders, but price has been reluctant to execute it cleanly.
SECTORS
Each S&P 500 Index component stock is assigned to one, and only one, of eleven major sectors. This is a snapshot of the Intermediate-Term and Long-Term Trend Model signal status for those sectors.
The bearish rising wedge has now executed on XLE. The 20-EMA dropped below the 50-EMA while both were below the 200-EMA. Support may have been found at the March low, but none of the indicators are bullish. The EMAs are now configured as negatively as they can be (5-EMA < 20-EMA < 50-EMA < 200-EMA). Maybe XLE can find support around $60.
STOCKS
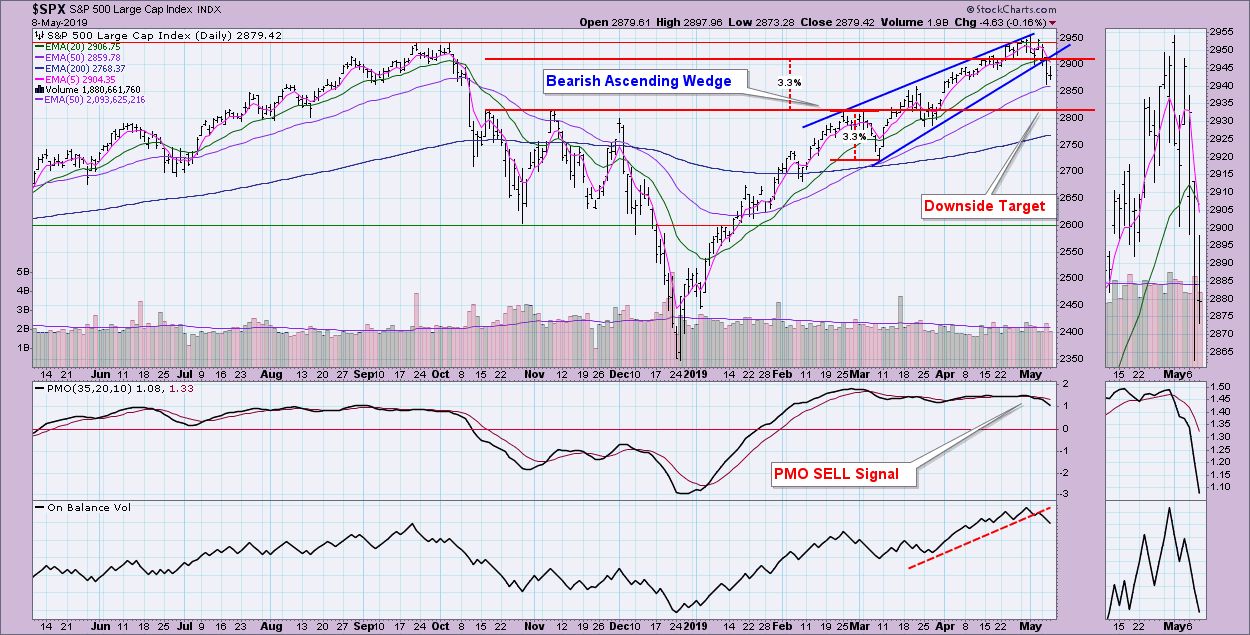
IT Trend Model: BUY as of 2/1/2019
LT Trend Model: BUY (SPY) as of 2/26/2019
SPY Daily Chart: You can see that the 5-EMA crossed below the 20-EMA, triggering the STTM Neutral signal. It would have been a SELL signal had the crossover occurred BELOW the 50-EMA. We've all been watching this wedge for weeks and today we finally saw the pattern execute. The minimum downside target of the rising wedge is calculated by measuring the back of the pattern and measuring that distance from the point of the breakdown. The target would bring price down to the October/November tops. The PMO and OBV both suggest that the target will be reached before the rally returns.
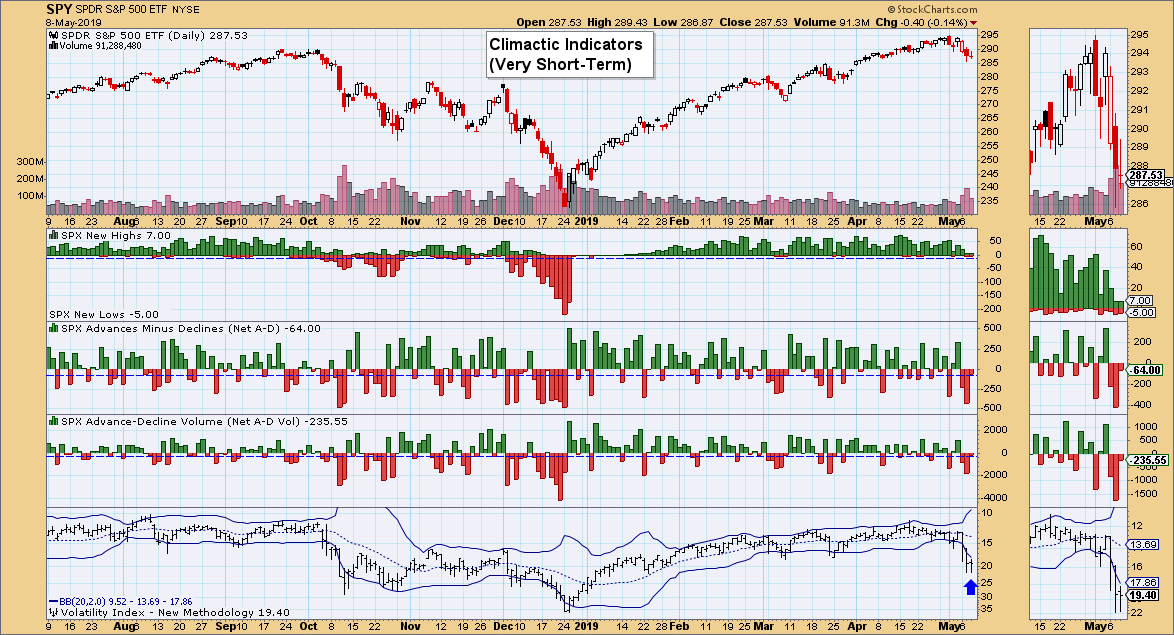
Climactic Market Indicators: The VIX Bollinger Band is expanding, yet the readings are still well below the lower band. When the bands begin to widen, volatility is strengthening. This is not a safe trading environment and, despite the visibility of these punctures, they aren't accompanied by any breadth to suggest this decline is over.
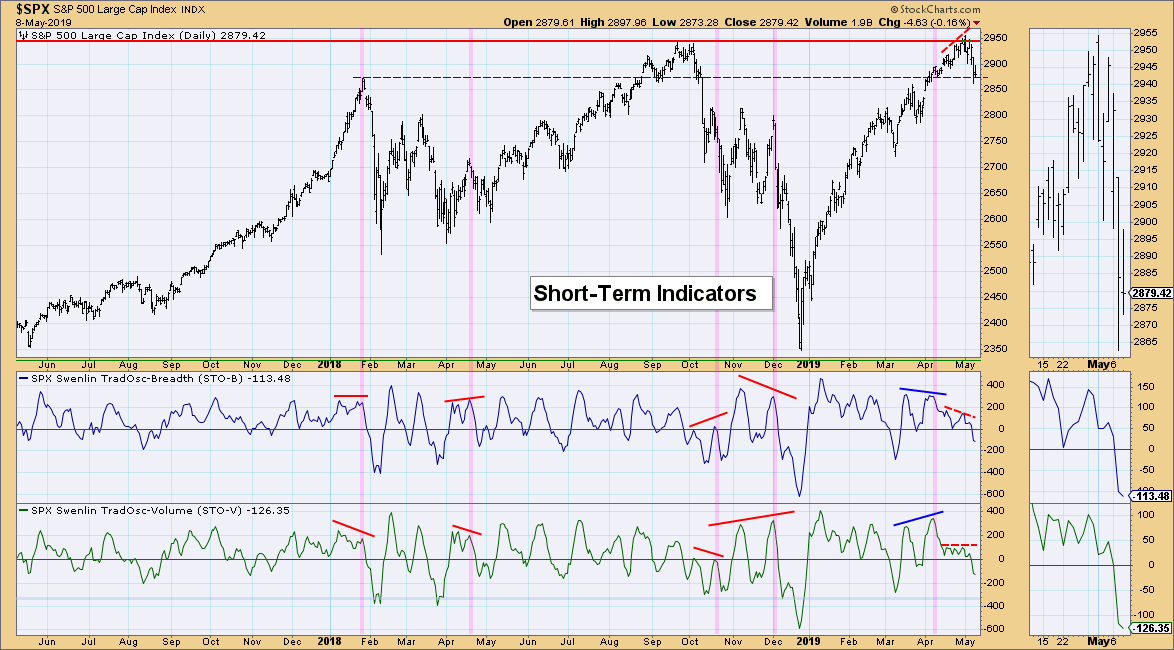
Short-Term Market Indicators: These are beginning to decelerate slightly, but have both reached negative territory. This has been considered oversold territory based on the typical range in a bull market. They remain bearish until I see them really begin to bottom.
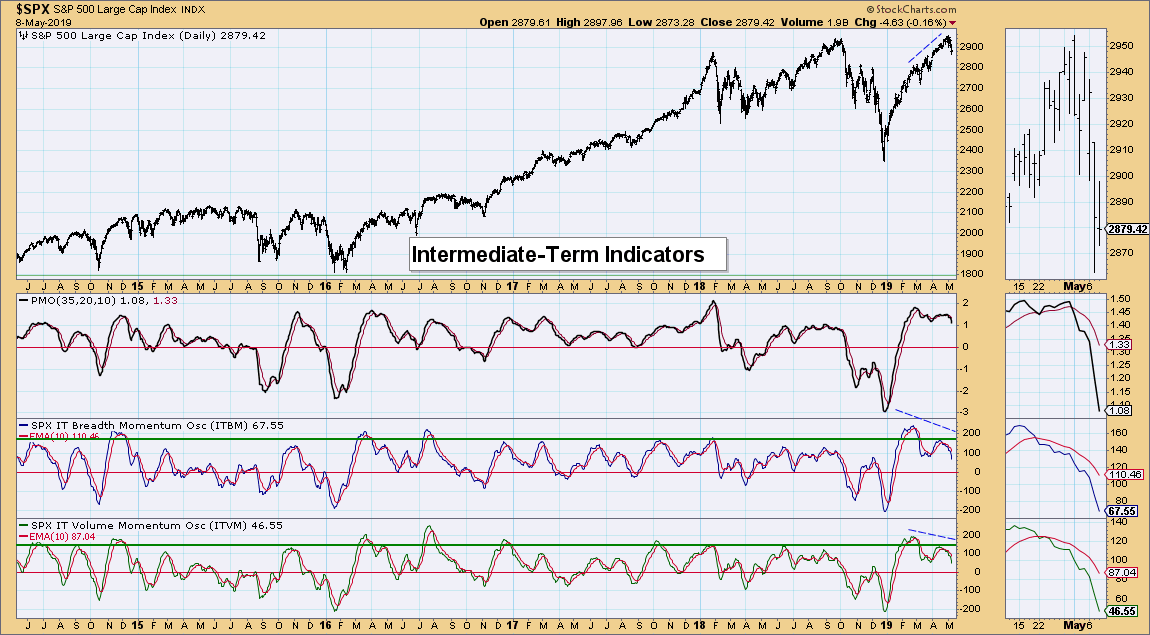
Intermediate-Term Market Indicators: Nothing good here. Very bearish and definitely not oversold.
Conclusion: I would've liked to have seen some climactic breadth numbers to accompany today's spike in the VIX, but we don't always get what we want. For this reason, along with the fact that DP indicators continue to decline, I am looking for a bit more follow-through on the recent decline...
Information posted to this board is not meant to suggest any specific action, but to point out the technical signs that can help our readers make their own specific decisions. Your Due Dilegence is a must! • DiscoverGold
Register for free to join our community of investors and share your ideas. You will also get access to streaming quotes, interactive charts, trades, portfolio, live options flow and more tools.


 News
News  Market Data
  Discover