


| Followers | 689 |
| Posts | 143817 |
| Boards Moderated | 35 |
| Alias Born | 03/10/2004 |
Saturday, April 27, 2019 12:11:59 AM
By: Carl Swenlin | April 26, 2019
IT Trend Model: BUY as of 2/19/2019
LT Trend Model: BUY as of 4/17/2019
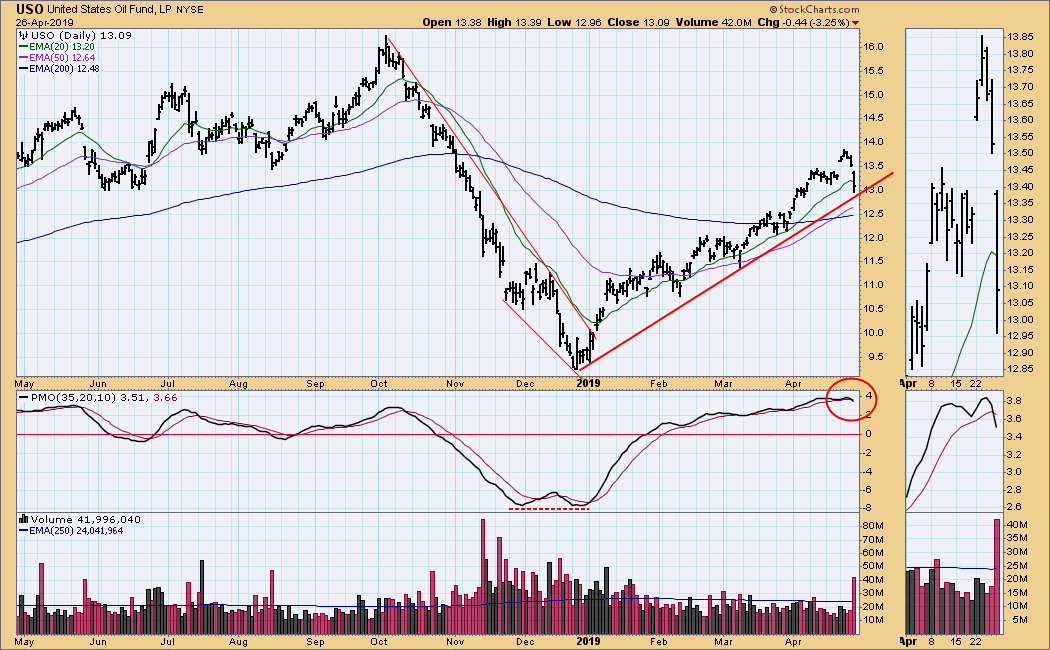
USO Daily Chart: On Monday the Trump administration announced tighter sanctions against Iran, and crude oil gapped up about +2%. From there it consolidated a few days, then it crashed on Friday. Because of the lack of follow through after Monday's gap, I was not surprised to see the breakdown. My guess is that crude is not in as short supply as we are led to believe. The daily PMO has crossed down through its signal line from very overbought levels.
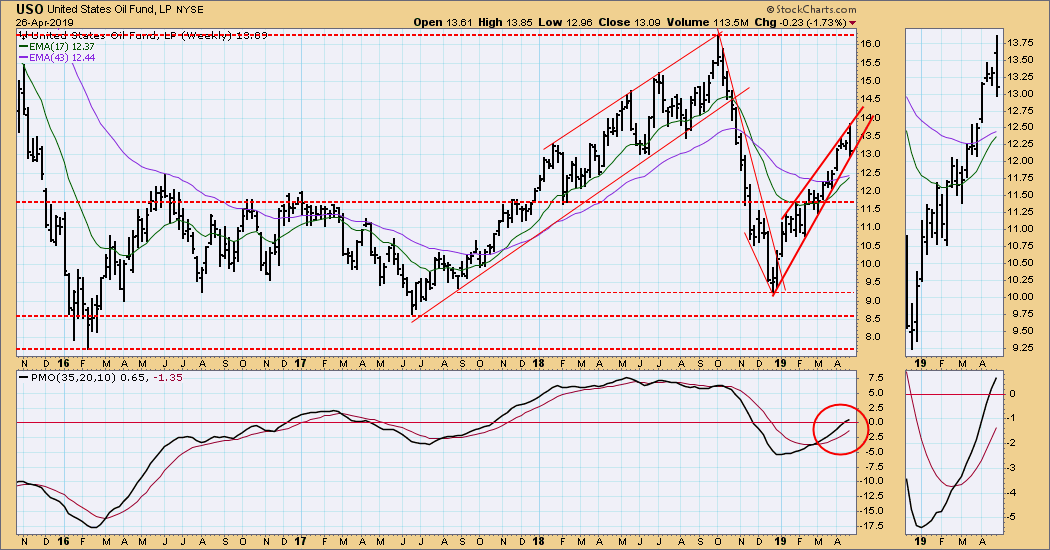
USO Weekly Chart: A rising wedge pattern implies that a pullback could be on the way, but the weekly PMO is rising and above the zero line. The 2018 high for USO represents about $76 for $WTIC.
Read Full Story »»»
• DiscoverGold
Click on "In reply to", for Authors past commentaries
Information posted to this board is not meant to suggest any specific action, but to point out the technical signs that can help our readers make their own specific decisions. Your Due Dilegence is a must!
• DiscoverGold
VHAI - Vocodia Partners with Leading Political Super PACs to Revolutionize Fundraising Efforts • VHAI • Sep 19, 2024 11:48 AM
Dear Cashmere Group Holding Co. AKA Swifty Global Signs Binding Letter of Intent to be Acquired by Signing Day Sports • DRCR • Sep 19, 2024 10:26 AM
HealthLynked Launches Virtual Urgent Care Through Partnership with Lyric Health. • HLYK • Sep 19, 2024 8:00 AM
Element79 Gold Corp. Appoints Kevin Arias as Advisor to the Board of Directors, Strengthening Strategic Leadership • ELMGF • Sep 18, 2024 10:29 AM
Mawson Finland Limited Further Expands the Known Mineralized Zones at Rajapalot: Palokas step-out drills 7 metres @ 9.1 g/t gold & 706 ppm cobalt • MFL • Sep 17, 2024 9:02 AM
PickleJar Announces Integration With OptCulture to Deliver Holistic Fan Experiences at Venue Point of Sale • PKLE • Sep 17, 2024 8:00 AM

