


| Followers | 689 |
| Posts | 143817 |
| Boards Moderated | 35 |
| Alias Born | 03/10/2004 |
Thursday, April 25, 2019 9:50:23 AM
By: Julius de Kempenaer | April 25, 2019
In the case of QCOM, it is clearly the settlement on the royalty dispute with AAPL. I am by no means a fundamental analyst but from what I understood this was something that was overshadowing QCOM's performance for quite some time already. The fact that this issue is now gone makes a big difference and the market is acknowledging that.
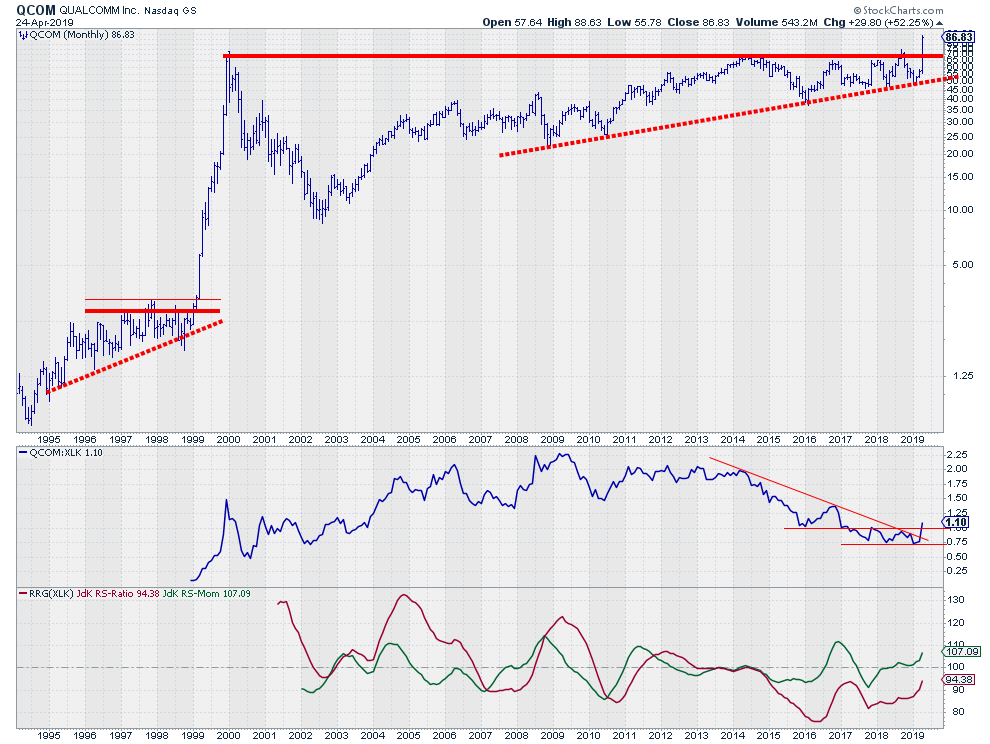
Reason enough to start digging and look beyond the last 12 months of price performance and pull up some longer term charts. The monthly chart printed above this article caught my eye.
At first sight, the recent jump in price from $ 58 to $ 86 looks like a very steep move and probably too late to jump on board.
A Different View
The monthly chart, using a log scale, tells a different story.
What we see here is a break to the highest level in 20 years in a very convincing way. The month is not over yet but a drop back below that breakout area between $ 70-75 seems very unlikely (but keep that in the back of your head nevertheless).
This former barrier of steel that acted as resistance for 20 years will now very likely come back as support in case of declines and with virtually no overhead resistance and the downside well protected it makes QCOM very attractive from a technical point of view.
The last time QCOM rose to new all-time-highs was at the start of 1999... Just saying ;)
The relative strength of QCOM vs XLK reached its high in 2009 and after some sideways movement, really started to decline from 2014 onwards. That decline recently ended when the RS-Line completed a double bottom and broke its previous high for the first time since 2009 while at the same time taking out the falling resistance line.
And this relative strength line is nowhere near all-time highs yet!
From a relative perspective, the party has only just begun.
From a trading perspective, you may want to wait for a throwback towards the new support area to optimize the entry or split positions in half or thirds and buy 1 part at the market and the remaining part(s) at lower levels if possible.
Julius de Kempenaer
Senior Technical Analyst, StockCharts.com
Creator, Relative Rotation Graphs
Founder, RRG Research
Read Full Story »»»
• DiscoverGold
Information posted to this board is not meant to suggest any specific action, but to point out the technical signs that can help our readers make their own specific decisions. Your Due Dilegence is a must!
• DiscoverGold
Recent QCOM News
- Visa Faces Monopoly Lawsuit; Meta Introduces Celebrity Voices for Chatbot; Stellantis on the Hunt for New CEO • IH Market News • 09/24/2024 10:15:50 AM
- Apollo Eyes $5 Billion Investment in Intel; TSMC and Samsung Explore UAE Chip Projects, and More • IH Market News • 09/23/2024 10:32:25 AM
- AIG names new CFO; Progyny Drops 24% After Losing Key 2025 Contract; Exicure Jumps 190% With Nasdaq Extension • IH Market News • 09/19/2024 10:26:48 AM
- Form 4 - Statement of changes in beneficial ownership of securities • Edgar (US Regulatory) • 09/06/2024 08:13:55 PM
- Broadcom Down 10% Post-Earnings, UiPath Up 8%; Qualcomm Eyes Intel Assets; Salesforce Acquires Own Company • IH Market News • 09/06/2024 11:59:00 AM
- Form 144 - Report of proposed sale of securities • Edgar (US Regulatory) • 09/05/2024 08:02:04 PM
- Qualcomm Develops Mixed Reality Glasses; Verizon to Boost Dividend, Eyes Acquisition; Samsonite Plans US Dual Listing • IH Market News • 09/05/2024 10:11:35 AM
- Form 4 - Statement of changes in beneficial ownership of securities • Edgar (US Regulatory) • 09/04/2024 08:07:03 PM
- Form 4 - Statement of changes in beneficial ownership of securities • Edgar (US Regulatory) • 09/04/2024 08:06:45 PM
- Form 144 - Report of proposed sale of securities • Edgar (US Regulatory) • 09/03/2024 09:18:30 PM
- Form 144 - Report of proposed sale of securities • Edgar (US Regulatory) • 09/03/2024 08:08:35 PM
- Form 4 - Statement of changes in beneficial ownership of securities • Edgar (US Regulatory) • 08/21/2024 08:22:15 PM
- FuboTV Soars 12% After Venu Sports Block, Goldman Sachs Lowers U.S. Recession Odds, BHP Ends Chile Strike • IH Market News • 08/19/2024 09:28:19 AM
- Deutsche Bank Faces Shareholder Backlash, Bank of America Sponsors 2026 World Cup, Quanterix CEO Buys More Shares • IH Market News • 08/16/2024 10:03:21 AM
- Google Mandated to Modify Play Store, Apple Innovates, Victoria’s Secret Hires CEO, Mars Buys Kellanova • IH Market News • 08/15/2024 10:05:46 AM
- Google Forced to Modify Play Store, Apple Innovates, Victoria’s Secret Hires CEO, Mars Buys Kellanova • IH Market News • 08/15/2024 10:05:46 AM
- Form 8-K - Current report • Edgar (US Regulatory) • 08/09/2024 08:05:49 PM
- Form 4 - Statement of changes in beneficial ownership of securities • Edgar (US Regulatory) • 08/09/2024 08:05:43 PM
- Form 4 - Statement of changes in beneficial ownership of securities • Edgar (US Regulatory) • 08/09/2024 08:05:27 PM
- Form 144 - Report of proposed sale of securities • Edgar (US Regulatory) • 08/08/2024 09:01:47 PM
- Form 4 - Statement of changes in beneficial ownership of securities • Edgar (US Regulatory) • 08/05/2024 09:03:28 PM
- Form 144 - Report of proposed sale of securities • Edgar (US Regulatory) • 08/02/2024 08:01:38 PM
- Qualcomm Gewinnmitteilung auf der Investor Relations Website des Unternehmens verfügbar • Business Wire • 07/31/2024 10:50:00 PM
- Publication des résultats de Qualcomm disponible sur le site web de la société consacré aux relations avec les investisseurs • Business Wire • 07/31/2024 10:50:00 PM
- Form 10-Q - Quarterly report [Sections 13 or 15(d)] • Edgar (US Regulatory) • 07/31/2024 08:02:08 PM
North Bay Resources Commences Operations at Bishop Gold Mill, Inyo County, California; Engages Sabean Group Management Consulting • NBRI • Sep 25, 2024 9:15 AM
CEO David B. Dorwart Anticipates a Bright Future at Good Gaming Inc. Through His Most Recent Shareholder Update • GMER • Sep 25, 2024 8:30 AM
Cannabix Technologies and Omega Laboratories Inc. Advance Marijuana Breathalyzer Technology - Dr. Bruce Goldberger to Present at Society of Forensic Toxicologists Conference • BLOZF • Sep 24, 2024 8:50 AM
Integrated Ventures, Inc Announces Strategic Partnership For GLP-1 (Semaglutide) Procurement Through MedWell USA, LLC. • INTV • Sep 24, 2024 8:45 AM
Avant Technologies Accelerates Creation of AI-Powered Platform to Revolutionize Patient Care • AVAI • Sep 24, 2024 8:00 AM
VHAI - Vocodia Partners with Leading Political Super PACs to Revolutionize Fundraising Efforts • VHAI • Sep 19, 2024 11:48 AM

