


| Followers | 689 |
| Posts | 143817 |
| Boards Moderated | 35 |
| Alias Born | 03/10/2004 |
Monday, April 22, 2019 9:51:03 AM
The Market Is Telling Us to Fade Fund Managers
By: Schaeffer's Investment Research | April 22, 2019
You can never totally rule out a correction, so here's how to hedge a risk-on portfolio
Tech stocks are overbought right now, and some hesitation around IXIC 8,000 is possible
"History suggests that a run through 2,900 and back to the September intraday high of 2,940 is imminent. Since 1950, in the 11 instances in which the SPX experienced at least a 20% decline from intraday high to intraday low, as it did in the fourth quarter, and then rallied back to within 2% of its intraday high, which occurred on Friday when the SPX closed above 2,882.09, the previous intraday high was touched on nine of those occasions within 33 calendar days."
-- Monday Morning Outlook, April 8, 2019
"… with standard April options expiration coming on Thursday, due to an exchange holiday on Good Friday, sellers of April 290-strike calls may try to keep the SPDR S&P 500 ETF Trust (SPY - 290.16) from pushing above the 290 strike through Thursday's close. The 290 strike is home to peak call open interest in the immediate vicinity of the SPY."
-- Monday Morning Outlook, April 15, 2019
A holiday-shortened April expiration week did not bring much drama and, in fact, played out like I anticipated, with the SPDR S&P 500 ETF Trust (SPY - 290.02) 290 strike -- equivalent to the round-number 2,900 on the S&P 500 Index (SPX - 2,905.03) -- acting as a hesitation area. Moreover, down days were relatively benign.
Nonetheless, the SPX is still around multi-month highs and just 1.22% below its September all-time intraday high of 2,940.91. As I pointed out two weeks ago, history suggests that this intraday high will be touched by early to mid-April, based on past recoveries to within 2% of a previous high following a 20% pullback. The SPX got to within 2% of its all-time intraday high on April 5 and has made progress toward 1,940, despite being in a technically "overbought" condition for most of this month.
Todd Salamone
@toddsalamone
Since nearing 1,600 earlier this month, $RUT has stalled...Same for $SPX at 2,900... $IXIC now battling 8k
1
4:03 PM - Apr 17, 2019
Twitter Ads info and privacy
See Todd Salamone's other Tweets
A Federal Open Market Committee (FOMC) policy meeting is two weeks away, on May 1, and key equity benchmarks seem to be in a sideways grind around important round numbers heading into this meeting, as I observed on Twitter late last week. While the SPX and Nasdaq Composite (IXIC - 7,998.06) have not experienced notable rejections at 2,900 and 8,000, respectively, the Russell 2000 Index (RUT - 1,565.75) continues to be a source of disappointment, as it sold off on Thursday and Friday after reaching a peak 10 points south of 1,600 earlier in the week. When 1,600 was touched in late February, small-cap investors were rudely treated to a one-month decline of more than 6.5% before the round 1,500 area acted as support.
In late January and mid-March, the FOMC held interest rates steady, and the SPX responded with rallies over the subsequent month -- which was expected, given the historically positive price action after a rate hold is announced since the rate-tightening cycle began in December 2015. With the Fed expected to hold rates steady again at this upcoming meeting, the May 1 policy announcement could be the next catalyst for a continued move higher in the stock market (even though "sell in May and go away" is likely to be an expression you hear as we move through the latter half of April).
"U.S. stocks just enjoyed their best quarter in at least six years, but last year's turbulence has left some skittish. Investors have poured a record amount of cash into so-called smart funds that try to protect against another downturn. They have also piled into exchange-traded products that offer insurance against market turbulence…funds that try to pick less-risky stocks took in a record $8 billion in the first quarter, the second straight quarterly record, according to Morningstar."
-- The Wall Street Journal, April 17, 2019
"Fund managers surveyed by Bank of America Merrill Lynch said they are long assets that typically outperform when economic growth and interest rates fall, including cash and utilities, according to the monthly BAML fund manager survey. They are short equities, banks and eurozone assets, which require higher borrowing costs and growth to outperform."
-- The Wall Street Journal, April 17, 2019
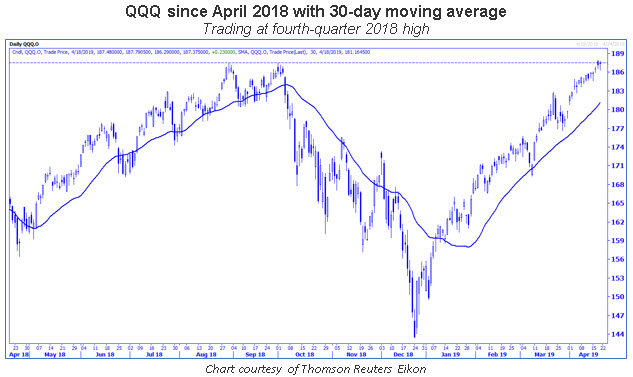
Technology stocks, as measured by the IXIC and the Invesco QQQ Trust (QQQ - 187.39) have clearly led the market higher, with gains of more than 20% in 2019. Contrast the price action in the perceived growth-type and risky technology names with the slow-growth, risk-averse actions of investors and funds, and the takeaway is that technology is not a crowded trade, despite the impressive price action. That said, technicians are likely focused on the QQQ, which enters the week at a level from which a significant sell-off occurred in the fourth quarter of 2018, and 30% above the December closing low.
Bulls would like to see a breakout, of course, but will likely be satisfied if the QQQ consolidates in the short term. After all, as it trades at an obvious potential resistance level, it too is oversold, per the 75 reading on its 14-day Relative Strength Index (RSI). Moreover, the IXIC is trading right around the 8,000 millennium area, and round numbers can sometimes act as major speed bumps or reversal areas.
As I stated last week, the one area of risk that I see from a sentiment perspective is the extreme net short position among large speculators on Cboe Volatility Index (VIX - 12.09) futures, as reflected in the weekly Commitments of Traders (CoT) reports. Combine this risk with the QQQ trading at a previous resistance level, and I continue to advise using options to play long trade ideas, especially in the technology group. With earnings coming up and the potential for sideways movement, some options may be expensive -- so move deeper in the money or further out in time if sideways movement occurs in the next few weeks.
That said, the market is currently telling us to concentrate trading portfolios with "risk-on" positions -- the opposite of what fund managers are doing, per the most recent BAML survey. In other words, other than the positioning of VIX futures traders, the sentiment landscape suggests emphasizing long positions, as well. You can never totally rule out a correction, despite what the technical indicators are suggesting, so a long volatility play that could offer substantial reward if volatility explodes might be an appropriate hedge to a heavily concentrated "risk-on" portfolio.
Read Full Story »»»
• DiscoverGold
By: Schaeffer's Investment Research | April 22, 2019
You can never totally rule out a correction, so here's how to hedge a risk-on portfolio
Tech stocks are overbought right now, and some hesitation around IXIC 8,000 is possible
"History suggests that a run through 2,900 and back to the September intraday high of 2,940 is imminent. Since 1950, in the 11 instances in which the SPX experienced at least a 20% decline from intraday high to intraday low, as it did in the fourth quarter, and then rallied back to within 2% of its intraday high, which occurred on Friday when the SPX closed above 2,882.09, the previous intraday high was touched on nine of those occasions within 33 calendar days."
-- Monday Morning Outlook, April 8, 2019
"… with standard April options expiration coming on Thursday, due to an exchange holiday on Good Friday, sellers of April 290-strike calls may try to keep the SPDR S&P 500 ETF Trust (SPY - 290.16) from pushing above the 290 strike through Thursday's close. The 290 strike is home to peak call open interest in the immediate vicinity of the SPY."
-- Monday Morning Outlook, April 15, 2019
A holiday-shortened April expiration week did not bring much drama and, in fact, played out like I anticipated, with the SPDR S&P 500 ETF Trust (SPY - 290.02) 290 strike -- equivalent to the round-number 2,900 on the S&P 500 Index (SPX - 2,905.03) -- acting as a hesitation area. Moreover, down days were relatively benign.
Nonetheless, the SPX is still around multi-month highs and just 1.22% below its September all-time intraday high of 2,940.91. As I pointed out two weeks ago, history suggests that this intraday high will be touched by early to mid-April, based on past recoveries to within 2% of a previous high following a 20% pullback. The SPX got to within 2% of its all-time intraday high on April 5 and has made progress toward 1,940, despite being in a technically "overbought" condition for most of this month.
Todd Salamone
@toddsalamone
Since nearing 1,600 earlier this month, $RUT has stalled...Same for $SPX at 2,900... $IXIC now battling 8k
1
4:03 PM - Apr 17, 2019
Twitter Ads info and privacy
See Todd Salamone's other Tweets
A Federal Open Market Committee (FOMC) policy meeting is two weeks away, on May 1, and key equity benchmarks seem to be in a sideways grind around important round numbers heading into this meeting, as I observed on Twitter late last week. While the SPX and Nasdaq Composite (IXIC - 7,998.06) have not experienced notable rejections at 2,900 and 8,000, respectively, the Russell 2000 Index (RUT - 1,565.75) continues to be a source of disappointment, as it sold off on Thursday and Friday after reaching a peak 10 points south of 1,600 earlier in the week. When 1,600 was touched in late February, small-cap investors were rudely treated to a one-month decline of more than 6.5% before the round 1,500 area acted as support.
In late January and mid-March, the FOMC held interest rates steady, and the SPX responded with rallies over the subsequent month -- which was expected, given the historically positive price action after a rate hold is announced since the rate-tightening cycle began in December 2015. With the Fed expected to hold rates steady again at this upcoming meeting, the May 1 policy announcement could be the next catalyst for a continued move higher in the stock market (even though "sell in May and go away" is likely to be an expression you hear as we move through the latter half of April).
"U.S. stocks just enjoyed their best quarter in at least six years, but last year's turbulence has left some skittish. Investors have poured a record amount of cash into so-called smart funds that try to protect against another downturn. They have also piled into exchange-traded products that offer insurance against market turbulence…funds that try to pick less-risky stocks took in a record $8 billion in the first quarter, the second straight quarterly record, according to Morningstar."
-- The Wall Street Journal, April 17, 2019
"Fund managers surveyed by Bank of America Merrill Lynch said they are long assets that typically outperform when economic growth and interest rates fall, including cash and utilities, according to the monthly BAML fund manager survey. They are short equities, banks and eurozone assets, which require higher borrowing costs and growth to outperform."
-- The Wall Street Journal, April 17, 2019
Technology stocks, as measured by the IXIC and the Invesco QQQ Trust (QQQ - 187.39) have clearly led the market higher, with gains of more than 20% in 2019. Contrast the price action in the perceived growth-type and risky technology names with the slow-growth, risk-averse actions of investors and funds, and the takeaway is that technology is not a crowded trade, despite the impressive price action. That said, technicians are likely focused on the QQQ, which enters the week at a level from which a significant sell-off occurred in the fourth quarter of 2018, and 30% above the December closing low.
Bulls would like to see a breakout, of course, but will likely be satisfied if the QQQ consolidates in the short term. After all, as it trades at an obvious potential resistance level, it too is oversold, per the 75 reading on its 14-day Relative Strength Index (RSI). Moreover, the IXIC is trading right around the 8,000 millennium area, and round numbers can sometimes act as major speed bumps or reversal areas.

As I stated last week, the one area of risk that I see from a sentiment perspective is the extreme net short position among large speculators on Cboe Volatility Index (VIX - 12.09) futures, as reflected in the weekly Commitments of Traders (CoT) reports. Combine this risk with the QQQ trading at a previous resistance level, and I continue to advise using options to play long trade ideas, especially in the technology group. With earnings coming up and the potential for sideways movement, some options may be expensive -- so move deeper in the money or further out in time if sideways movement occurs in the next few weeks.
That said, the market is currently telling us to concentrate trading portfolios with "risk-on" positions -- the opposite of what fund managers are doing, per the most recent BAML survey. In other words, other than the positioning of VIX futures traders, the sentiment landscape suggests emphasizing long positions, as well. You can never totally rule out a correction, despite what the technical indicators are suggesting, so a long volatility play that could offer substantial reward if volatility explodes might be an appropriate hedge to a heavily concentrated "risk-on" portfolio.
Read Full Story »»»
• DiscoverGold
Information posted to this board is not meant to suggest any specific action, but to point out the technical signs that can help our readers make their own specific decisions. Your Due Dilegence is a must!
• DiscoverGold
Join the InvestorsHub Community
Register for free to join our community of investors and share your ideas. You will also get access to streaming quotes, interactive charts, trades, portfolio, live options flow and more tools.

