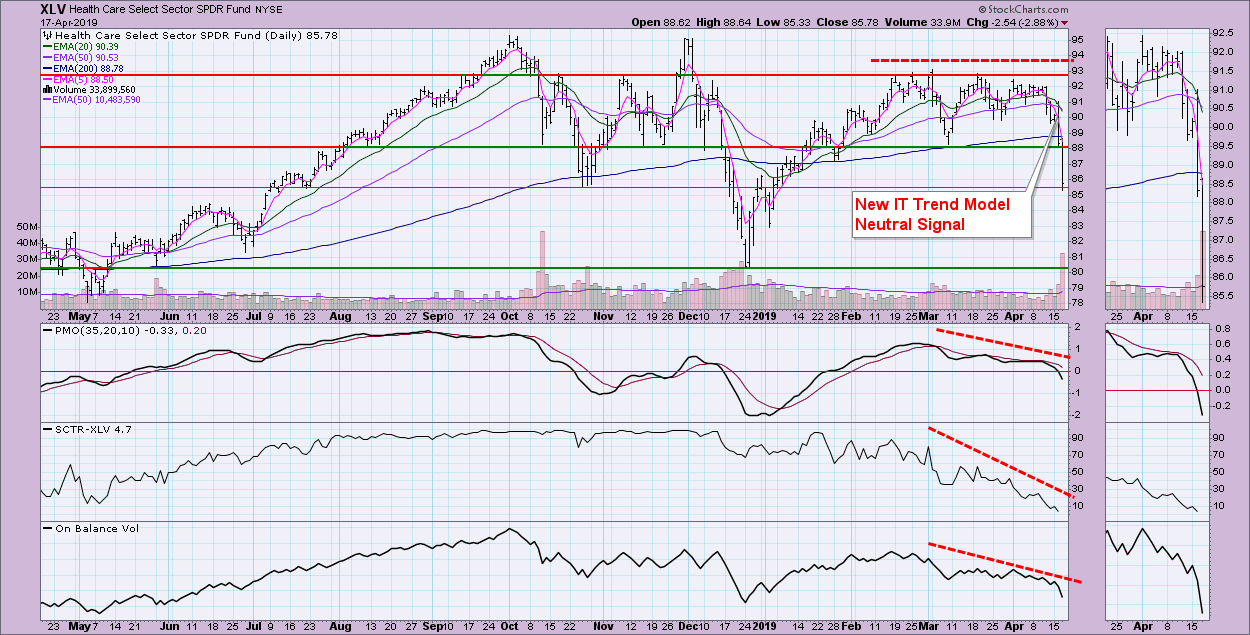
Buying Exhaustion Alongside a Broadening Pattern - XLV IT Neutral Signal By: Erin Swenlin | April 17, 2019
At this point in the week, the SPX is down about 0.23%. I suspect there will be more downside to endure going into the last half of the week. We don't talk about broadening patterns too much, but, in the very short-term, those are what I'm seeing on the SPX and they typically resolve downward. The VIX is now suggesting a buying exhaustion lining up as well. The good news is that the defensive Health Care Sector ETF (XLV) did trigger an IT Trend Model Neutral signal. I'd prefer everyone pitch in on a rally to new all-time highs, but if I'm going to lose a BUY signal, I'd rather it be in a defensive area of the market.
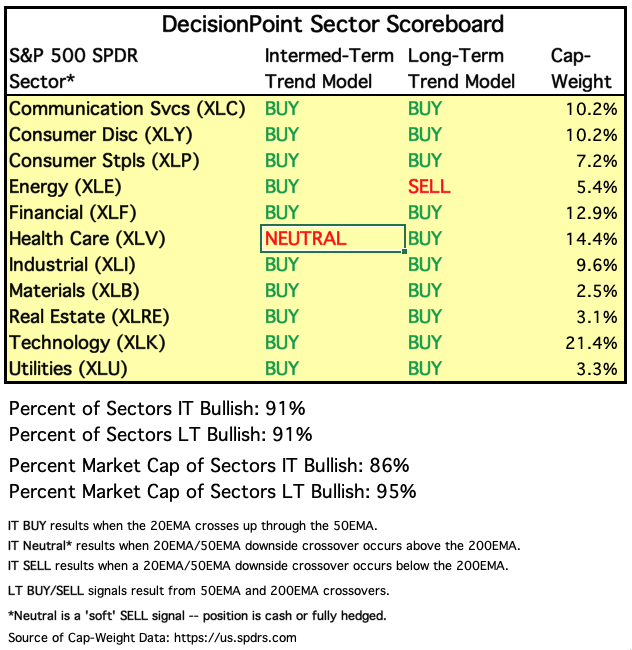
SECTORS
Each S&P 500 Index component stock is assigned to one, and only one, of eleven major sectors. This is a snapshot of the Intermediate-Term and Long-Term Trend Model signal status for those sectors.
The daily chart of XLV shows the 20-EMA crossing below the 50-EMA. This is what triggered the IT Trend Model Neutral signal. It is a neutral signal because the crossover occurred above the 200-EMA. We don't go to a full SELL or short position when the 50-EMA is above the 200-EMA; we use "neutral" to mean fully hedged or in cash. Of course, looking at the chart, I imagine all of us wish we had shorted this sector. Price had tested support yesterday at the March low (which coincides with plenty of lows in October and November). Not only did it not hold today, though, it broke down all the way down to the October low! Next stop: the December low. This sector was already beginning to show signs of fatigue, given all of the negative divergences with price.
STOCKS
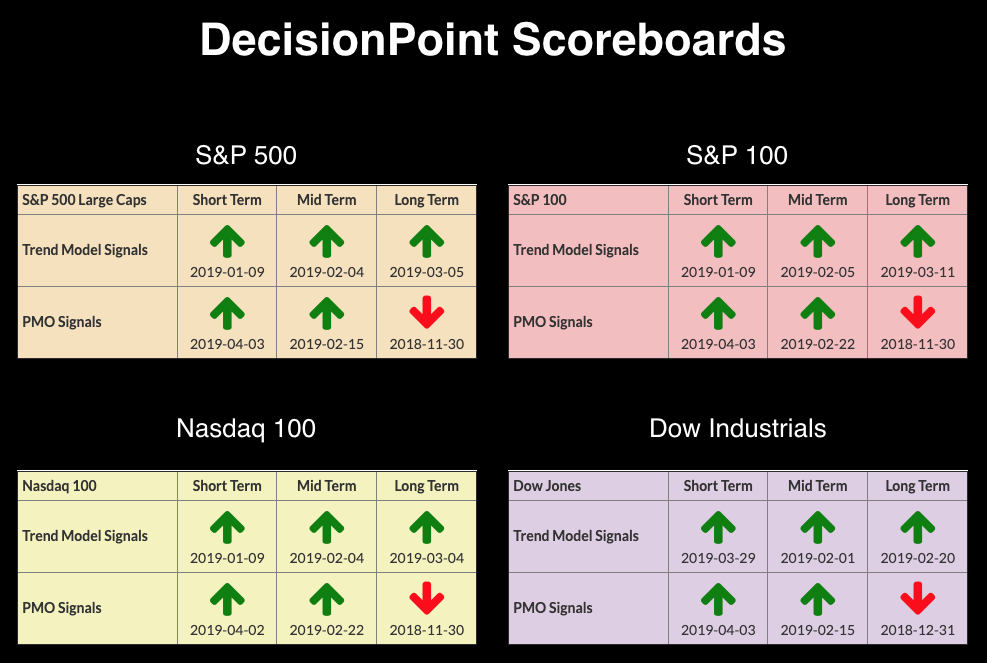
IT Trend Model: BUY as of 2/1/2019
LT Trend Model: BUY (SPY) as of 2/26/2019
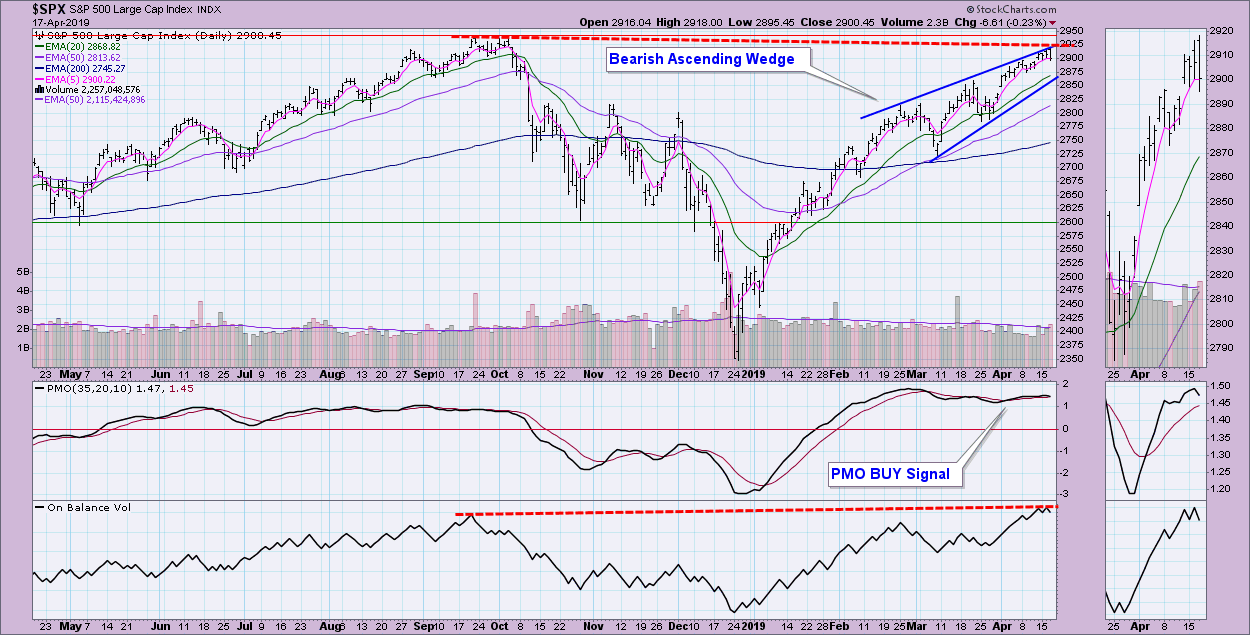
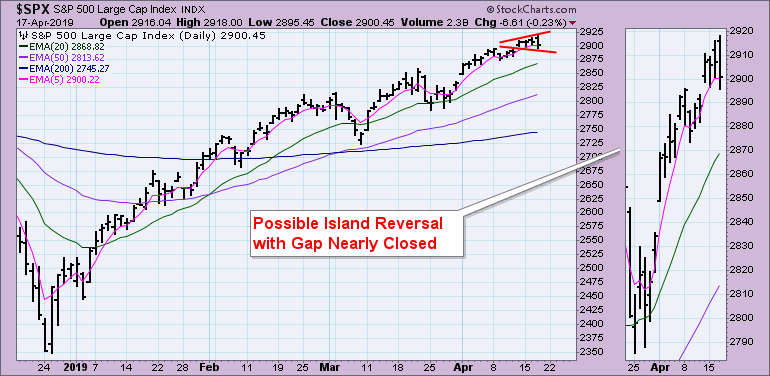
SPY Daily Chart: I've been watching a bearish rising wedge on the SPX. Price has been bumping against the top of the wedge multiple times. The OBV is rising with price, but, as Carl pointed out last week, the last OBV top has not exceeded the top at the all-time high. This is a reverse divergence in that, if you see volume pushing higher but price isn't doing the same, there might be less voracity in the price move and it could be hard to maintain a rising trend. The good news is that we don't actually have a new price top.
The broadening formation looks like a short-term "horn" shape. Typically, these resolve downward. I also spot a possible island reversal in the thumbnail. Today, price attempted to close the gap, but it did not complete the move. I would look for that gap to close in the next day or two.
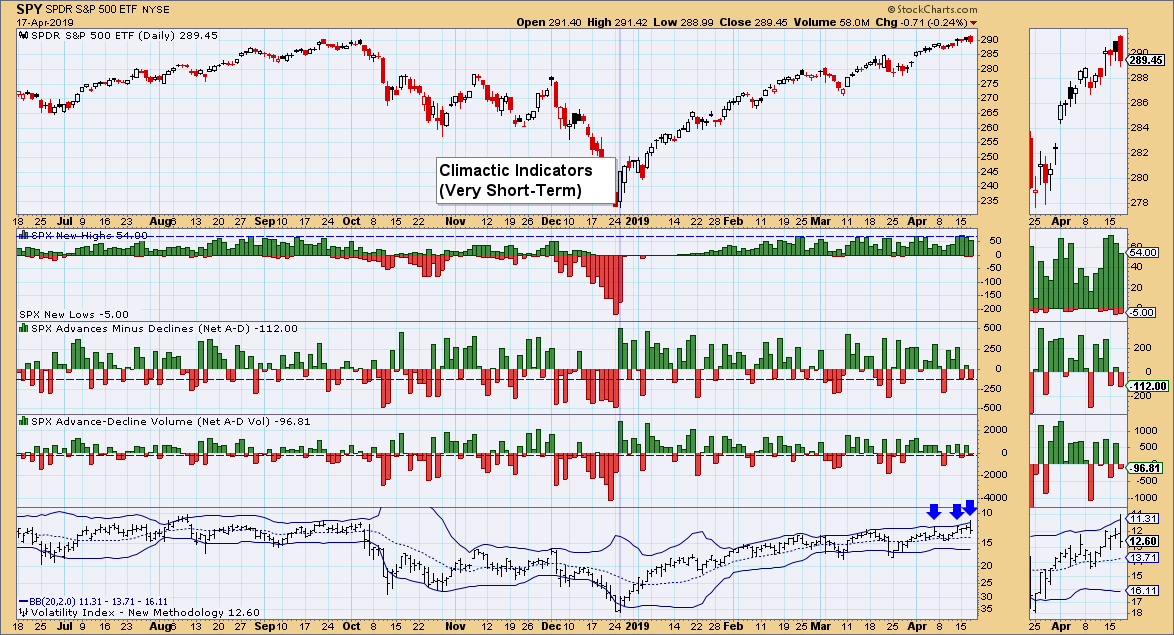
Climactic Market Indicators: One of the reasons I believe the SPX will turn lower this week is the deeply complacent readings on the VIX. We didn't see a puncture of the upper Bollinger Band on the prior tests, but today we got it. New Highs are beginning to move lower, but I'm not seeing anything overly climactic.
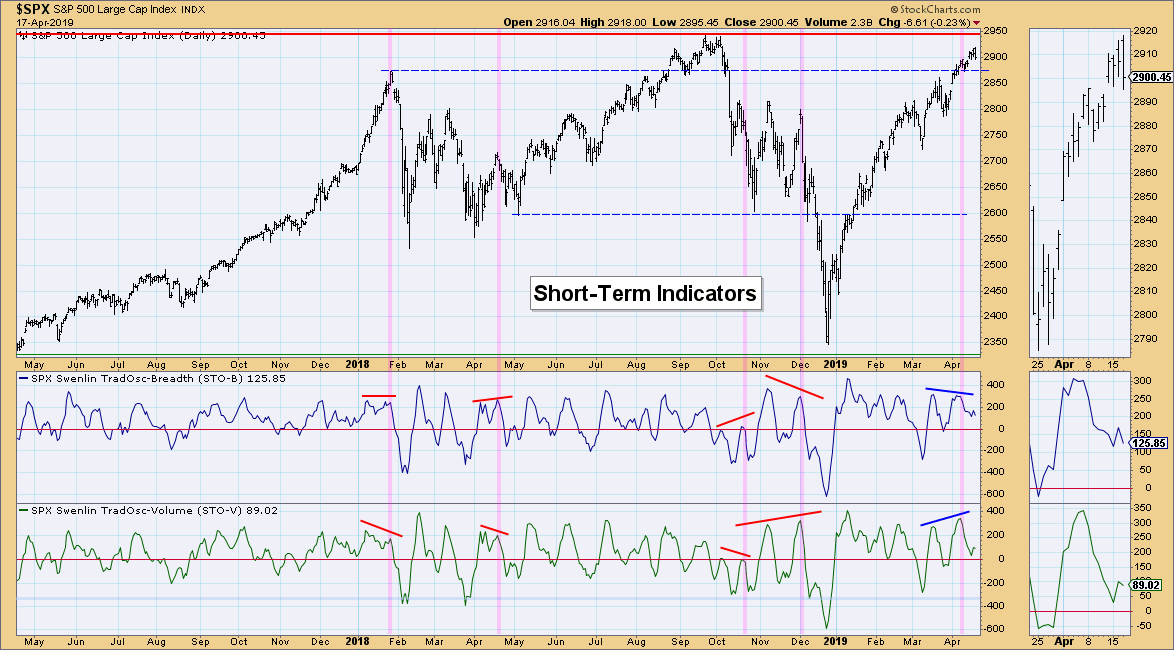
Short-Term Market Indicators: These also suggest a decline ahead. Although they have been hesitating, they are in a declining trend and are reaching bull market oversold just above the zero line. That said, I wouldn't count on that to hold, as these indicators can certainly accommodate more downside.
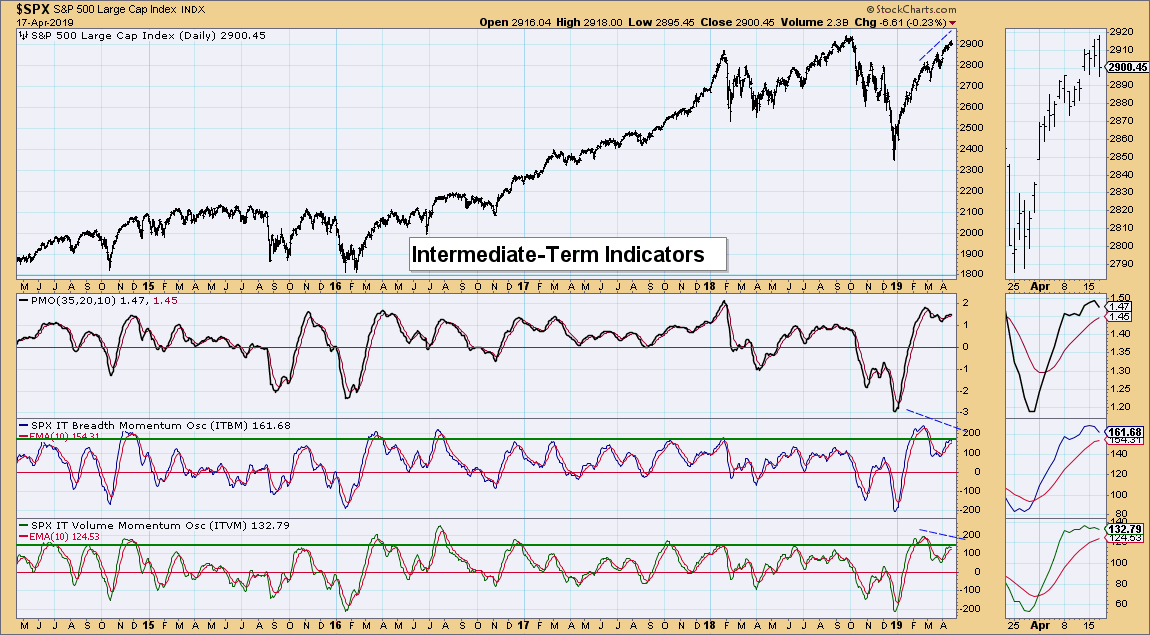
Intermediate-Term Market Indicators: These indicators have been struggling to stay positive. Currently, they are holding above the signal lines. Since they do tend to twitch, I prefer to wait for crossovers before making solid conclusions. However, they are both pointed lower and look to be headed for negative crossovers.
Conclusion: There are quite a few signs pointing to a bearish end to the week. The biggest concern are the negative indicators and the very low VIX numbers. Both suggest a downturn soon and there is also that gap to close.
Information posted to this board is not meant to suggest any specific action, but to point out the technical signs that can help our readers make their own specific decisions. Your Due Dilegence is a must! • DiscoverGold
Register for free to join our community of investors and share your ideas. You will also get access to streaming quotes, interactive charts, trades, portfolio, live options flow and more tools.


 News
News  Market Data
  Discover