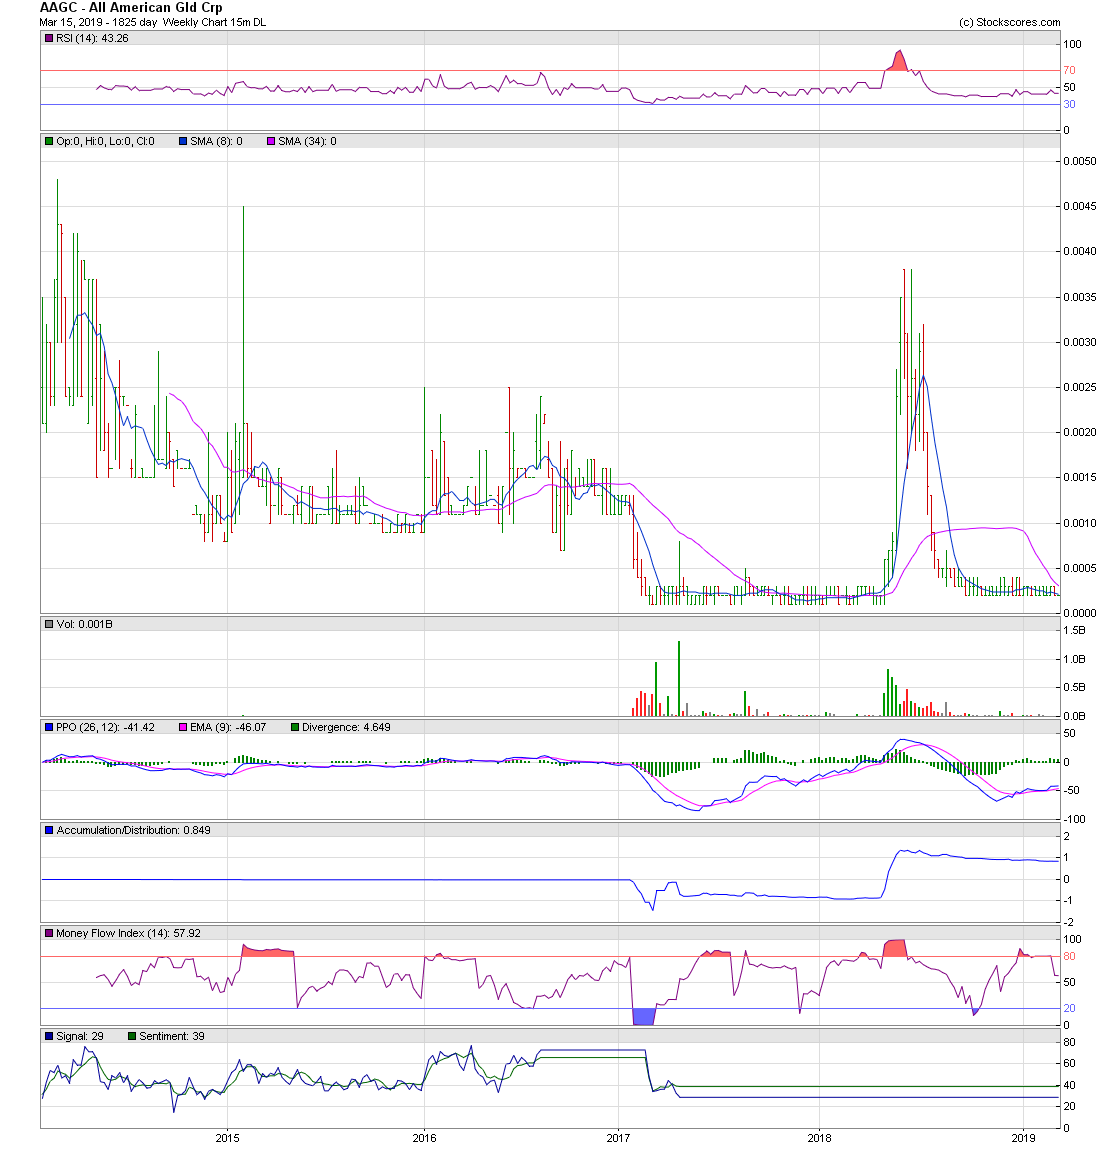
QEDN - AAGC https://investorshub.advfn.com/uicon/155361.png?cb=636360310707230000 ________________________________________________________________ Buy after an Elliott Wave 5-Wave Decline https://investorshub.advfn.com/boards/read_msg.aspx?message_id=147348217 https://investorshub.advfn.com/boards/read_msg.aspx?message_id=141766117 https://investorshub.advfn.com/boards/read_msg.aspx?message_id=139539638 http://investorshub.advfn.com/boards/read_msg.aspx?message_id=133786230 https://investorshub.advfn.com/boards/read_msg.aspx?message_id=135552097 ________________________________________________________________ The Elliott Wave 5-Waves Sequence A Basic "A,B,C Corrective Wave" https://www.metatrader5.com/en/terminal/help/objects/elliott/elliott_theory http://www.forexhit.com/learn-forex/elliott-wave-principle.html ________________________________________________________________ https://investorshub.advfn.com/uimage/uploads/2017/2/16/vvrclElliott_Wave_Decline_8_Wave.png https://investorshub.advfn.com/uimage/uploads/2017/2/16/hgymrElliott_Wave_Chart.png Elliott Wave Basics http://investorshub.advfn.com/boards/read_msg.aspx?message_id=113103065 Elliott Wave Principle http://www.forexhit.com/learn-forex/elliott-wave-principle.html Elliott Wave Theory http://ta.mql4.com/elliott_wave_theory Buy after an Elliott Wave, 5-Wave decline sequence ! A Basic "A,B,C Corrective Wave" Buy, ONLY when the stocks price, is trading under the Blue 8-day M.A. when the Blue 8-day M.A. is under the Red 34-day M.A . ________________________________________________________________ https://www.stockscores.com/charts/charts/?ticker=AAGC https://www.stockscores.com/charts/charts/?ticker=QEDN investorshub.advfn.com/uimage/uploads/2019/3/15/jyettAAGC_Mar_15_Chart_1825_day_Weekly.png https://www.stockscores.com/chart.asp?TickerSymbol=QEDN&TimeRange=2555&Interval=w&Volume=1&ChartType=OHLC&Stockscores=1&ChartWidth=1100&ChartHeight=480&LogScale=None&Band=None&avgType1=SMA&movAvg1=8&avgType2=SMA&movAvg2=34&Indicator1=RSI&Indicator2=PPO&Indicator3=AccDist&Indicator4=MFI&endDate=&CompareWith=&entryPrice=&stopLossPrice= https://investorshub.advfn.com/uicon/155361.png?cb=636776145039370000 investorshub.advfn.com/uimage/uploads/2019/3/15/fxbyvAAGC_Mar_15_Chart_1825_day_Daily.png https://www.stockscores.com/chart.asp?TickerSymbol=QEDN&TimeRange=2555&Interval=d&Volume=1&ChartType=OHLC&Stockscores=1&ChartWidth=1100&ChartHeight=480&LogScale=None&Band=None&avgType1=SMA&movAvg1=8&avgType2=SMA&movAvg2=34&Indicator1=RSI&Indicator2=PPO&Indicator3=AccDist&Indicator4=MFI&endDate=&CompareWith=&entryPrice=&stopLossPrice= https://investorshub.advfn.com/uicon/155361.png?cb=636776145039370000
 News
News  Market Data
  Discover