The Market Is Getting A Bit More Complex By: Avi Gilburt | January 16, 2019
Following the Elliott Wave analysis:
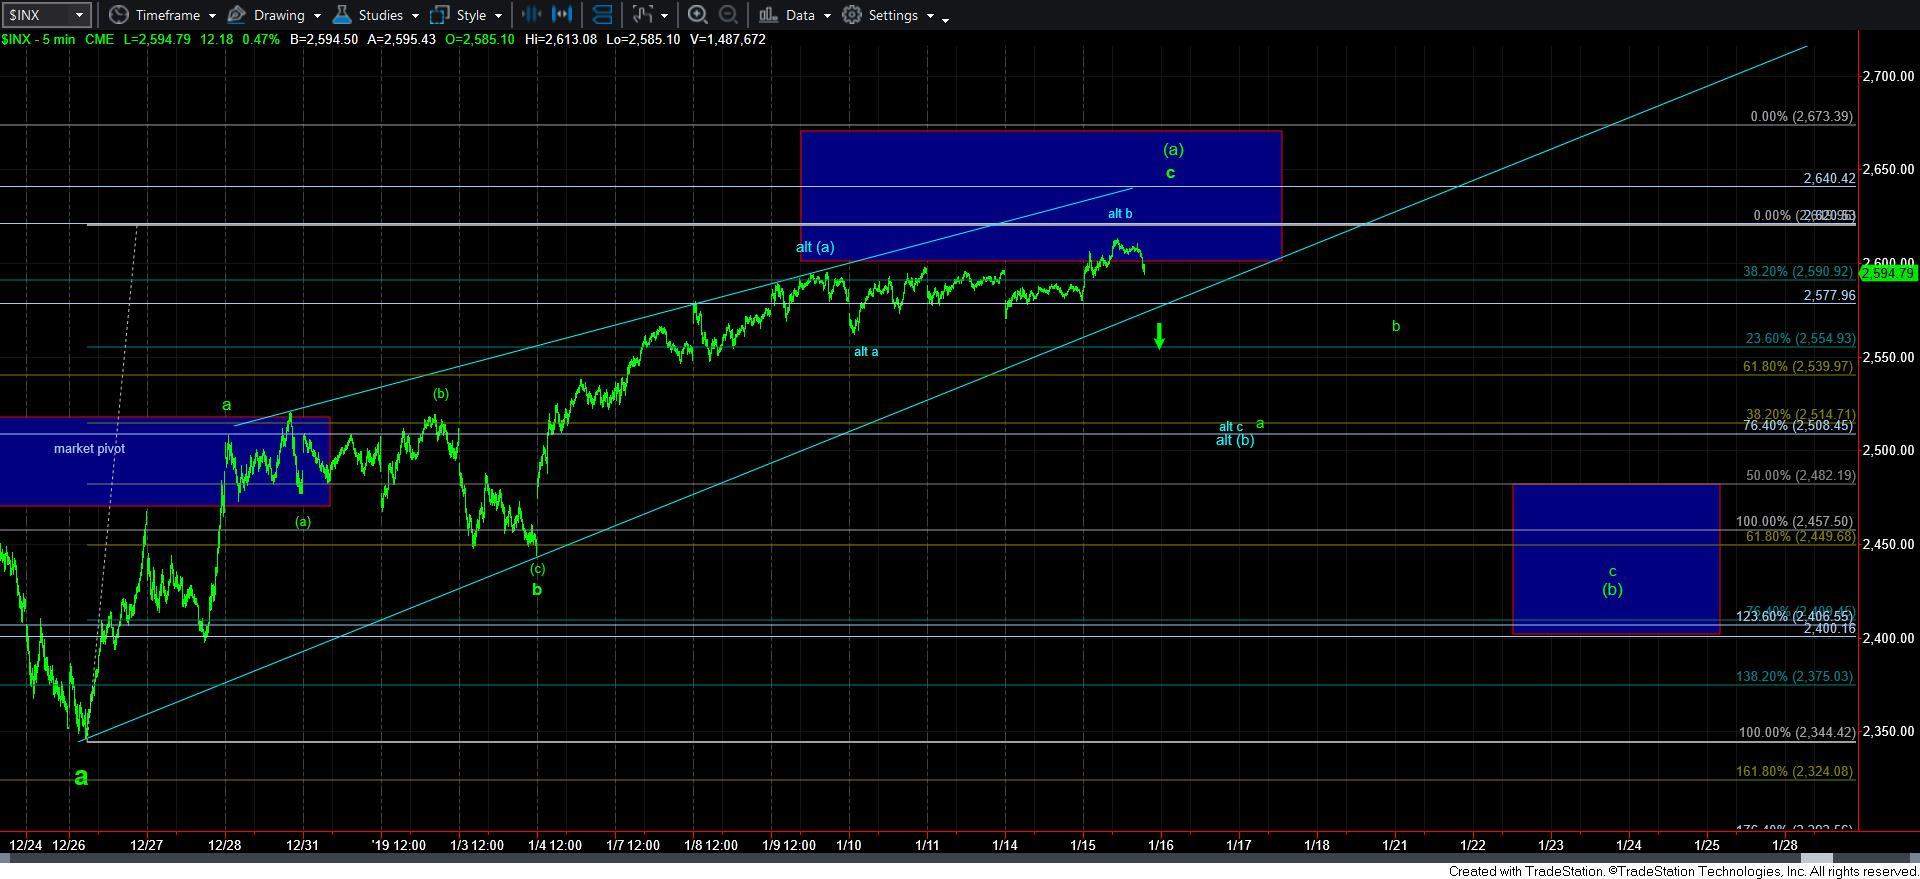
With the market breaking out through the resistance that we have been banging our heads against for the last 4 days, I was looking for a clear impulsive structure pointing us to a top to wave 4 of this c-wave of the [a] wave rally we have been tracking off the December lows in the market.
However, during the trading day, I sent out an update that said that the market “should” be able to move us through the 2608-2613ES resistance region, which would then make 2608ES support, on our way to the 2640 region. However, the market stopped dead cold at 2613ES, and turned down. That suggests that this move up is not a standard impulsive structure. Rather, at best, it would suggest that this 5th wave would be an ending diagonal – ASSUMING WE WERE TO CONTINUE HIGHER STILL.
The reason I have highlighted that last statement is because of the complexity that we will have to deal with if the market has topped today. You see, a top being struck today can allow us to maintain the prior wave structure which suggests the [a] wave topped last week. That would mean that if we were to continue lower in a 5-wave c-wave structure, then the b wave pullback may complete sooner than initially expected, and it may not break below the 2500SPX region. This potential is shown in blue now on my 5-minute chart.
For now, this is going to be my alternative perspective. But, should this complete a decline in the coming days to the 2500SPX region, and then provide us with an impulsive 5-wave structure off that low, rather than a corrective b-wave looking rally, it will suggest we are beginning the rally to 2800SPX a bit sooner than I had initially expected. For now, it is too early to jump into this perspective, but not too early to at least put you on notice of this potential.
If the market can continue a bit higher in the coming day or two to at least the 2620SPX region, then I can count an ending diagonal for this 5th wave of the c-wave of a. But, if we break down below the 2575/80 support sooner rather than later, I am going to be watching the potential for that blue count very carefully. I would not want this market to run away from us to 2800 without some amount of warning.
Click on "In reply to", for Authors past commentaries
Information posted to this board is not meant to suggest any specific action, but to point out the technical signs that can help our readers make their own specific decisions. Your Due Dilegence is a must! • DiscoverGold
Register for free to join our community of investors and share your ideas. You will also get access to streaming quotes, interactive charts, trades, portfolio, live options flow and more tools.


 News
News  Market Data
  Discover