


| Followers | 689 |
| Posts | 143817 |
| Boards Moderated | 35 |
| Alias Born | 03/10/2004 |
Saturday, January 19, 2019 10:14:24 AM
DP Weekly Wrap: Trade News Dominates; Technicals Lurk
By: Carl Swenlin | January 18, 2019
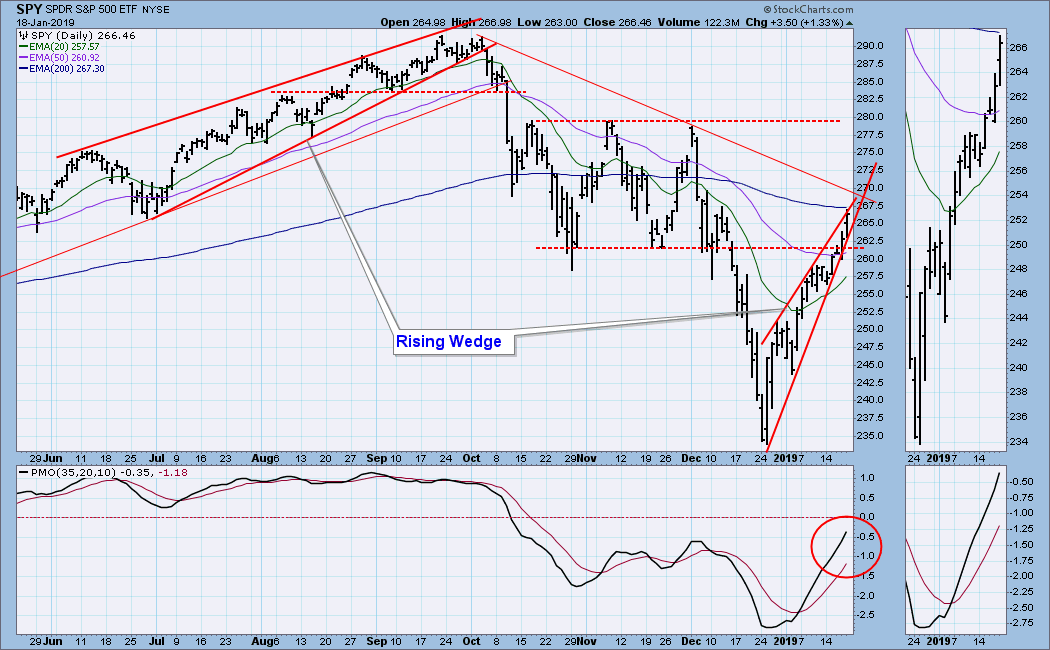
Just last week I wrote: There are two impending fundamental events to which the market is likely to react positively: (1) resolution of the trade issues with China; and (2) ending the government shutdown. Assuming that either event actually comes to pass, positive short-term reaction can be expected from either one, a reaction that could override negative short-term technical expectations; however, I don't think either of these events will end the bear market. On Thursday a rumor surfaced that the U.S. might lift some of the tariffs on Chinese goods, and the market rallied. The rally persisted even after the administration denied the story. Today a story broke that China had offered a way to eliminate the trade imbalance, and the market rally continued. Nevertheless, the dominant pattern on the chart is still the rising wedge, which is technically expected to resolve downward. Will this be one of those times when market beats the odds?
SECTORS
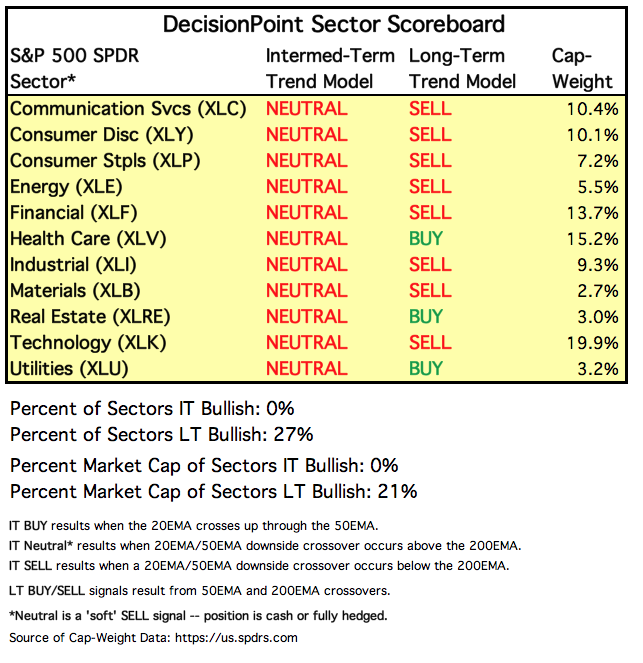
Each S&P 500 Index component stock is assigned to one, and only one, of 11 major sectors. This is a snapshot of the Intermediate-Term and Long-Term Trend Model signal status for those sectors.
We reported on the DecisionPoint show that an ITTM BUY signal had been generated today. That was an error on my part. Apologies.
STOCKS
IT Trend Model: NEUTRAL as of 10/15/2018
LT Trend Model: SELL as of 12/14/2018
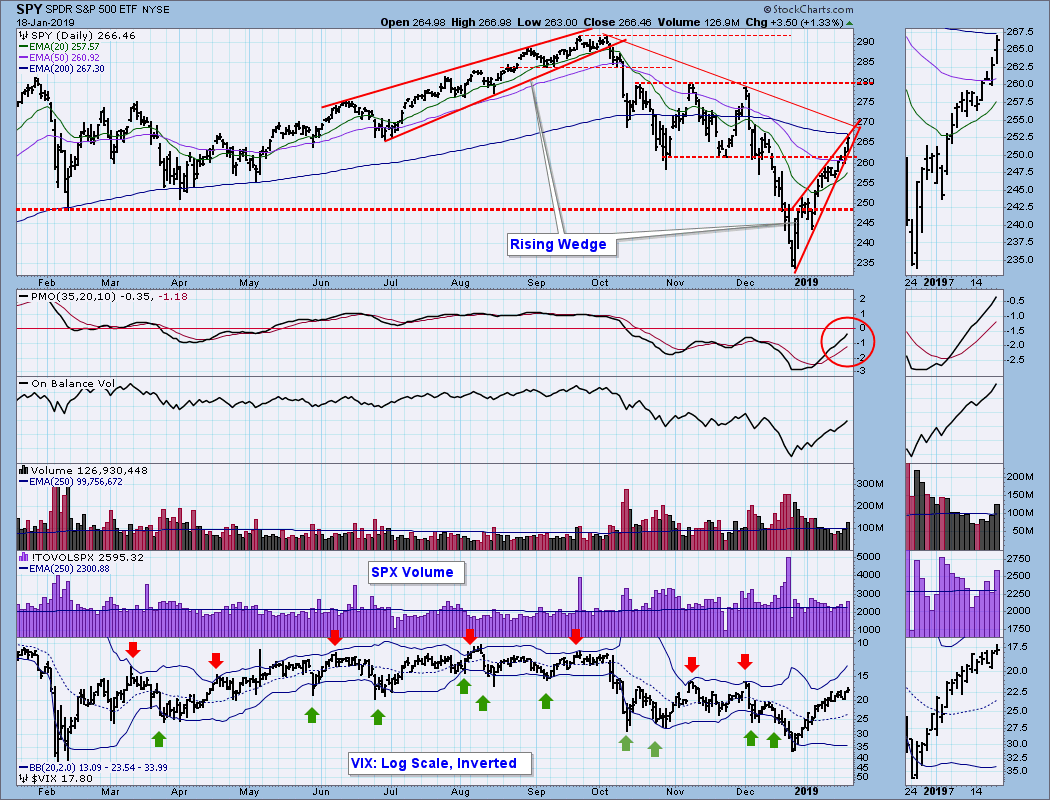
SPY Daily Chart: In spite of the news-fueled rally, the rising wedge has not yet been resolved, but there is very little room left inside the wedge, and it will have to resolve in a day or two. It isn't easy to see on the chart, but on Thursday SPY had started to break down out of the rising wedge pattern, but the news broke, and that was the end of that. This was options expiration week, so the higher-than-average volume could be attributed to that rather than commitment to the rally, but there is no way to tell. The VIX is looking toppy and has not reached the top Bollinger Band, which could be a prelude to a price reversal.
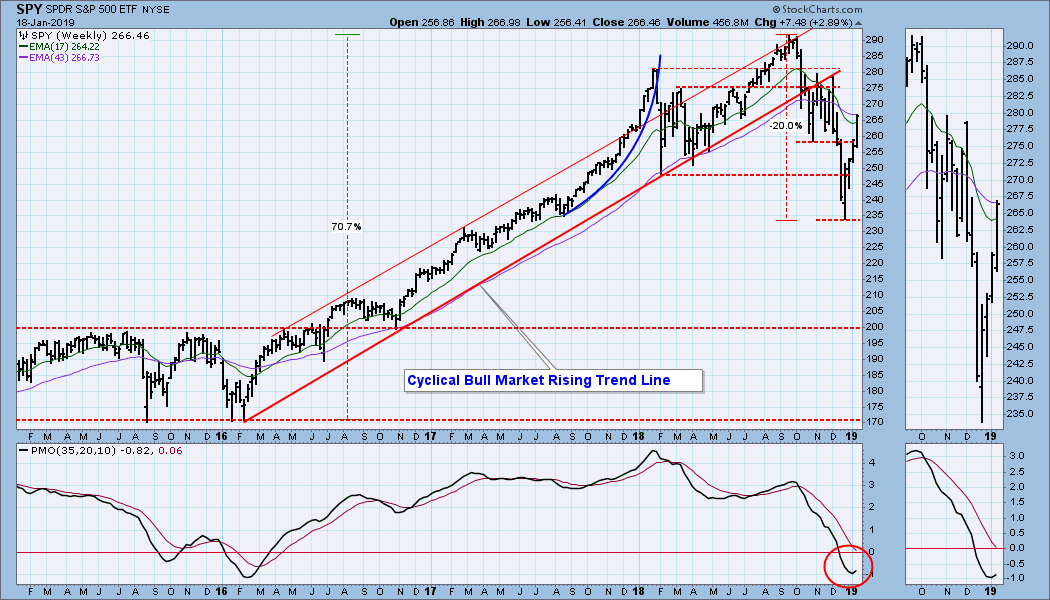
SPY Weekly Chart: Price penetrated the resistance level at about 258, and the weekly PMO has turned up. That's pretty bullish.
Short-Term Market Indicators: A continued rally in spite of last week's oversold indicator tops is bullish behavior.
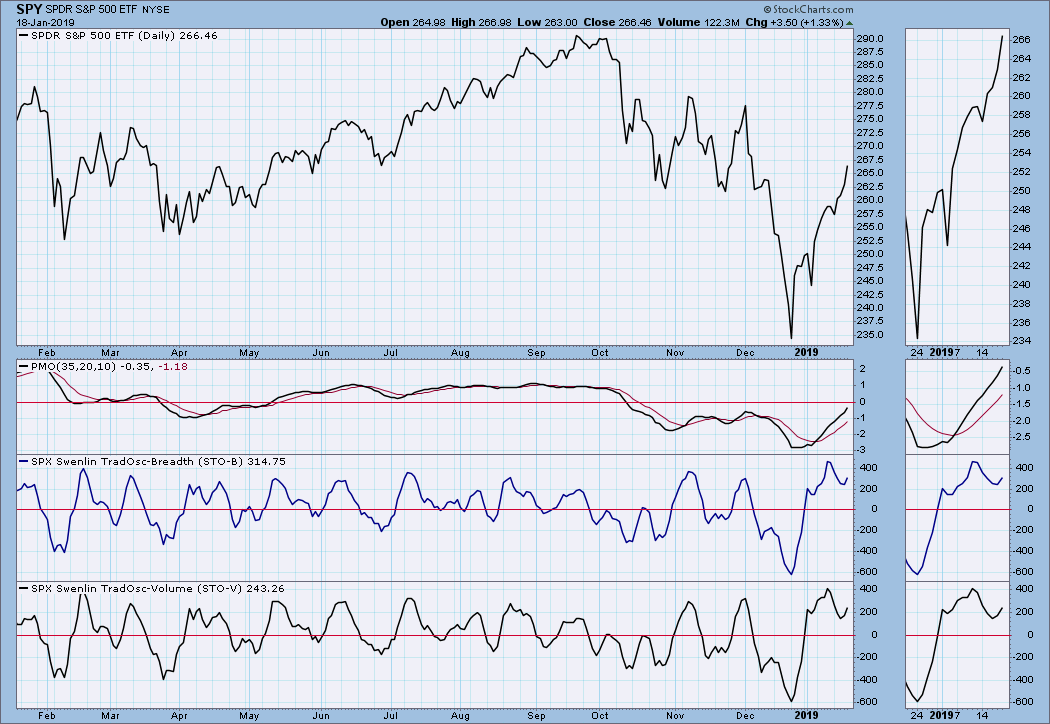
Intermediate-Term Market Indicators: The ITBM and ITVM are overbought. Let's see it the market cares.
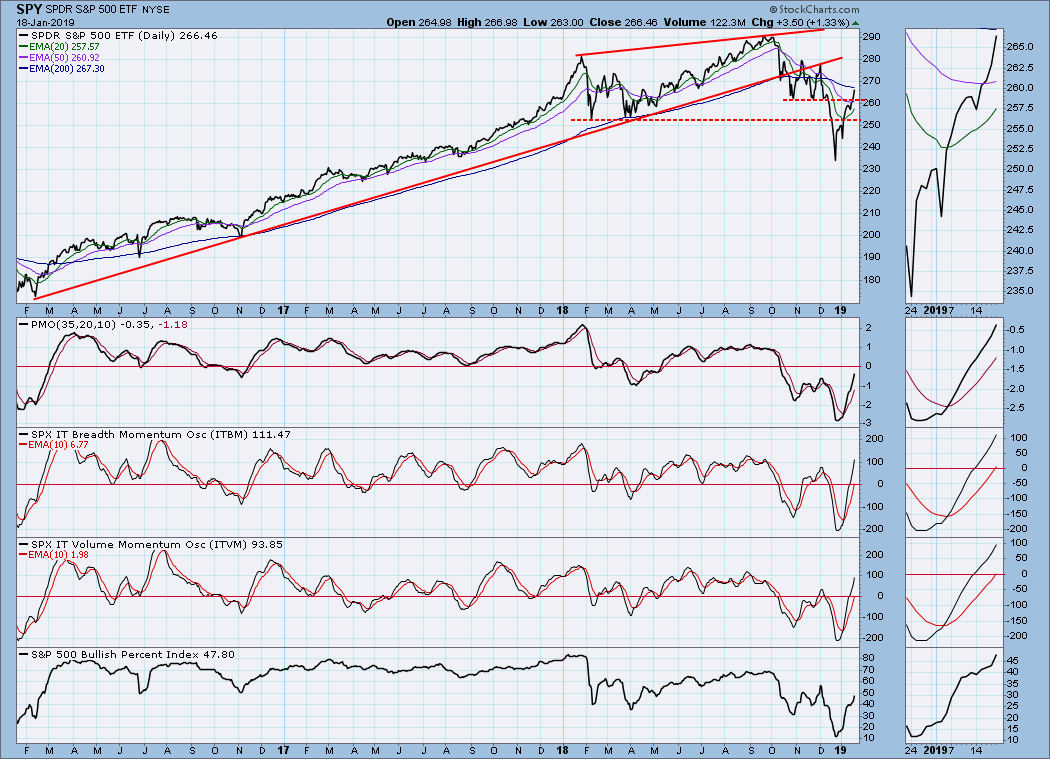
CONCLUSION: The news on trade is positive, but there is a long way to go before a final deal is made -- today's hope can easily be replaced by disappointment tomorrow. Technically, the weekly PMO bottom is very positive for the market longer-term. Of more immediate concern is the daily chart rising wedge formation. Odds are that it will resolve downward, but that won't necessarily mean that the rally is over. A pullback to set a less accelerated angle of ascent would be a healthy result. Do I think we're still in a bear market? I can see how it is possible that we are not.
Read Full Story »»»
• DiscoverGold
Click on "In reply to", for Authors past commentaries
By: Carl Swenlin | January 18, 2019
Just last week I wrote: There are two impending fundamental events to which the market is likely to react positively: (1) resolution of the trade issues with China; and (2) ending the government shutdown. Assuming that either event actually comes to pass, positive short-term reaction can be expected from either one, a reaction that could override negative short-term technical expectations; however, I don't think either of these events will end the bear market. On Thursday a rumor surfaced that the U.S. might lift some of the tariffs on Chinese goods, and the market rallied. The rally persisted even after the administration denied the story. Today a story broke that China had offered a way to eliminate the trade imbalance, and the market rally continued. Nevertheless, the dominant pattern on the chart is still the rising wedge, which is technically expected to resolve downward. Will this be one of those times when market beats the odds?

SECTORS
Each S&P 500 Index component stock is assigned to one, and only one, of 11 major sectors. This is a snapshot of the Intermediate-Term and Long-Term Trend Model signal status for those sectors.
We reported on the DecisionPoint show that an ITTM BUY signal had been generated today. That was an error on my part. Apologies.

STOCKS
IT Trend Model: NEUTRAL as of 10/15/2018
LT Trend Model: SELL as of 12/14/2018
SPY Daily Chart: In spite of the news-fueled rally, the rising wedge has not yet been resolved, but there is very little room left inside the wedge, and it will have to resolve in a day or two. It isn't easy to see on the chart, but on Thursday SPY had started to break down out of the rising wedge pattern, but the news broke, and that was the end of that. This was options expiration week, so the higher-than-average volume could be attributed to that rather than commitment to the rally, but there is no way to tell. The VIX is looking toppy and has not reached the top Bollinger Band, which could be a prelude to a price reversal.

SPY Weekly Chart: Price penetrated the resistance level at about 258, and the weekly PMO has turned up. That's pretty bullish.

Short-Term Market Indicators: A continued rally in spite of last week's oversold indicator tops is bullish behavior.

Intermediate-Term Market Indicators: The ITBM and ITVM are overbought. Let's see it the market cares.

CONCLUSION: The news on trade is positive, but there is a long way to go before a final deal is made -- today's hope can easily be replaced by disappointment tomorrow. Technically, the weekly PMO bottom is very positive for the market longer-term. Of more immediate concern is the daily chart rising wedge formation. Odds are that it will resolve downward, but that won't necessarily mean that the rally is over. A pullback to set a less accelerated angle of ascent would be a healthy result. Do I think we're still in a bear market? I can see how it is possible that we are not.
Read Full Story »»»
• DiscoverGold
Click on "In reply to", for Authors past commentaries
Information posted to this board is not meant to suggest any specific action, but to point out the technical signs that can help our readers make their own specific decisions. Your Due Dilegence is a must!
• DiscoverGold
Join the InvestorsHub Community
Register for free to join our community of investors and share your ideas. You will also get access to streaming quotes, interactive charts, trades, portfolio, live options flow and more tools.

