January Stock Rebound Continues By: John Murphy | January 19, 2019
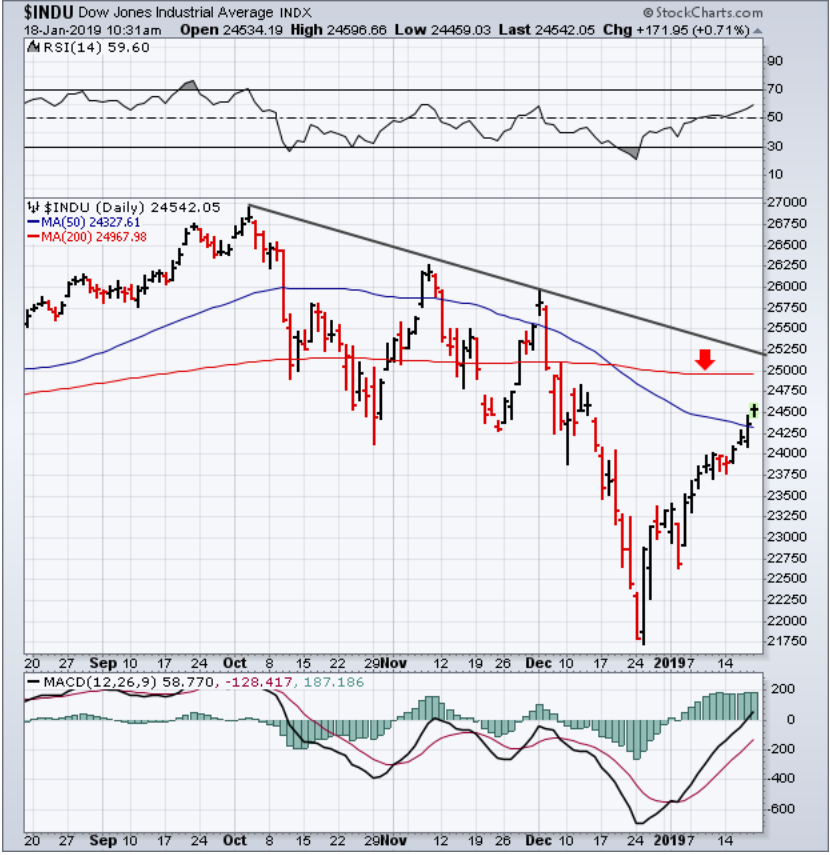
All major U.S. stock indexes have exceeded their 50-day averages (blue lines). That still leaves their 200-day averages to contain the rally. But there are a couple of other resistance lines that still need to be tested. Chart 1 shows the Dow Industrials nearing a test of their 200-day average (red arrow). In addition, the falling trendline drawn over its October/December highs should also provided stiff overhead resistance. The Dow would have to clear both barriers to signal a major turn to the upside. The same is true of the other two major stock indexes.
Information posted to this board is not meant to suggest any specific action, but to point out the technical signs that can help our readers make their own specific decisions. Your Due Dilegence is a must! • DiscoverGold
Register for free to join our community of investors and share your ideas. You will also get access to streaming quotes, interactive charts, trades, portfolio, live options flow and more tools.


 News
News  Market Data
  Discover