


| Followers | 689 |
| Posts | 143817 |
| Boards Moderated | 35 |
| Alias Born | 03/10/2004 |
Friday, January 18, 2019 10:16:04 AM
The Ultimate Test For The Bears Is Here
By: Tom Bowley | January 18, 2019
Word that the U.S. would ease Chinese tariffs as negotiations wear on helped to reduce stock market stress and resulted in an intraday surge in U.S. equity prices on Thursday afternoon. Quick profit taking followed, but strength resumed into the close as our major indices all finished higher, led by the Russell 2000's 0.86% advance. All 11 sectors finished higher in a broad-based rally that was led by materials (XLB, +1.76%) and industrials (XLI, +1.71%). The former's rally came right on time as I had posted the following chart two days ago and suggested a high reward to risk long trade made sense:
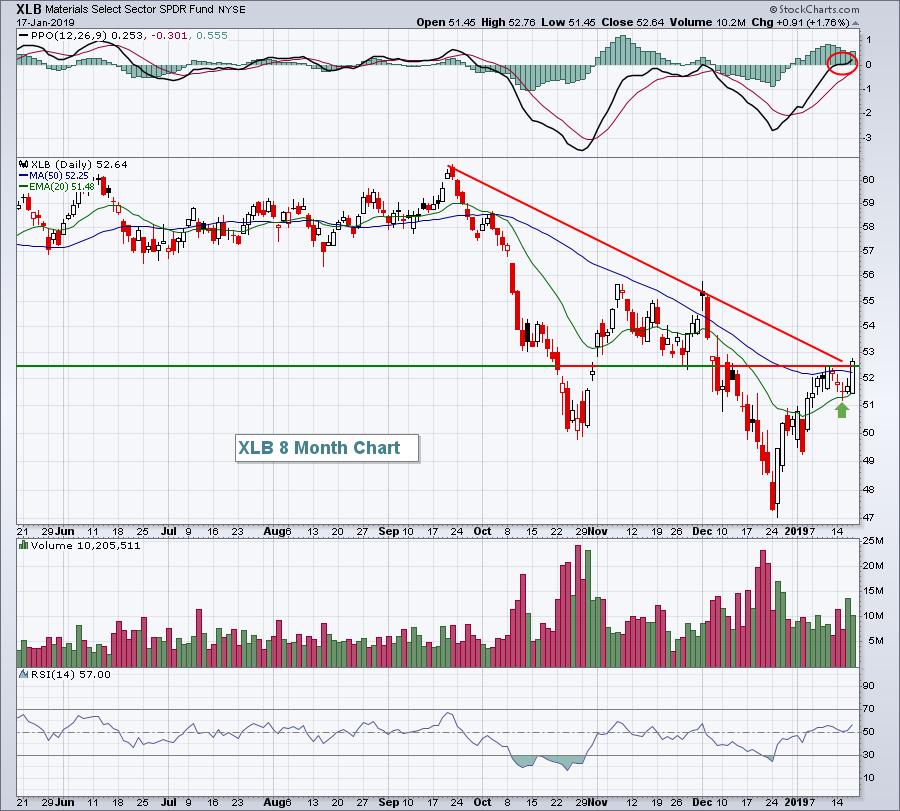
There are still obstacles ahead for the XLB, namely gap resistance near 53.60 and then the double top price resistance just beneath 56. Nonetheless, bouncing off rising 20 day EMA support is a solid short-term bullish signal. So long as that moving average provides support, I'd be ok sticking to the long side. A failure, however, should be respected because of the big picture downtrend that began in September 2018.
While the majority of the action on Thursday was quite bullish, there were pockets of weakness and disappointment. Home construction ($DJUSHB, -1.01%) was one of those areas, perhaps spooked by the threat of rising interest rates again. I wouldn't be overly concerned about the DJUSHB just yet as it continues to trade above its now-rising 20 week EMA at 683 and the pullback is nearing its recent breakout on the daily chart:
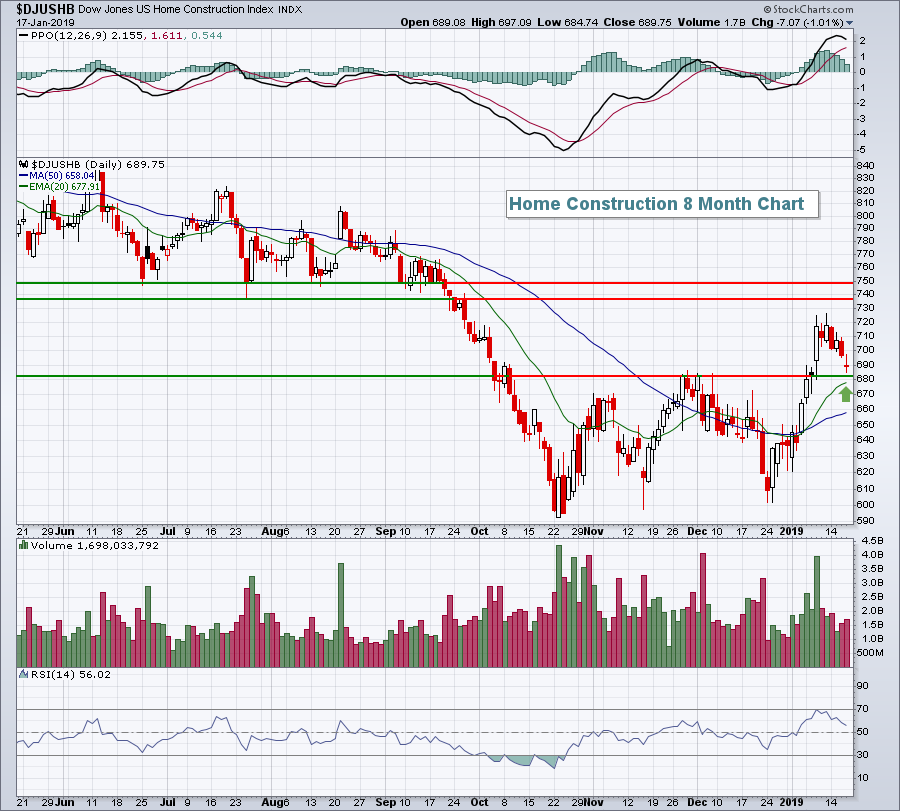
Seeing the daily RSI jump to 70 recently was another bullish signal for this group as RSI 70 rarely is touched during a downtrend. Note that the rising 20 day EMA is at 678, just beneath the 20 week EMA of 683 discussed earlier. A close beneath both would carry more bearish implications. Until then, however, I believe the long side is the right side.
Pre-Market Action
Netflix (NFLX) and American Express (AXP) both reported results last night that disappointed traders to a degree. Yet it's not slowing the move higher in U.S. equities this morning. NFLX, in particular, is well off after-market lows from last night despite falling short on revenues and being priced for perfection.
We're also seeing a global rally as different regions from around the world sense some relief with word that the U.S. will ease tariffs against China during ongoing negotiations.
Dow Jones futures are higher by 138 points with 30 minutes left to the opening bell.
Current Outlook
As the Volatility Index ($VIX) spiked on December 26th to 36 and a bottom formed, I wrote an article that looked ahead to figure out where this bear market rally might end. I pointed out three potential levels. The first was intraday support-turned-resistance at 2532 on the S&P 500. The second was closing support-turned-resistance at 2581. Both of those levels have been cleared and now leaves us with the third key level - 20 week EMA resistance. I made several observations more than three weeks ago in that article, most of them spot on, a couple perhaps not so good. I didn't think we'd see a VIX below 20 before another big drop occurred. Well, we haven't seen a big price drop and the VIX closed yesterday at 18.06. The stock market teaches us new lessons every day and this could be another, but I wouldn't be ready to throw the towel in just yet on this being nothing more than a bear market rally. Here's the current big picture S&P 500 chart:
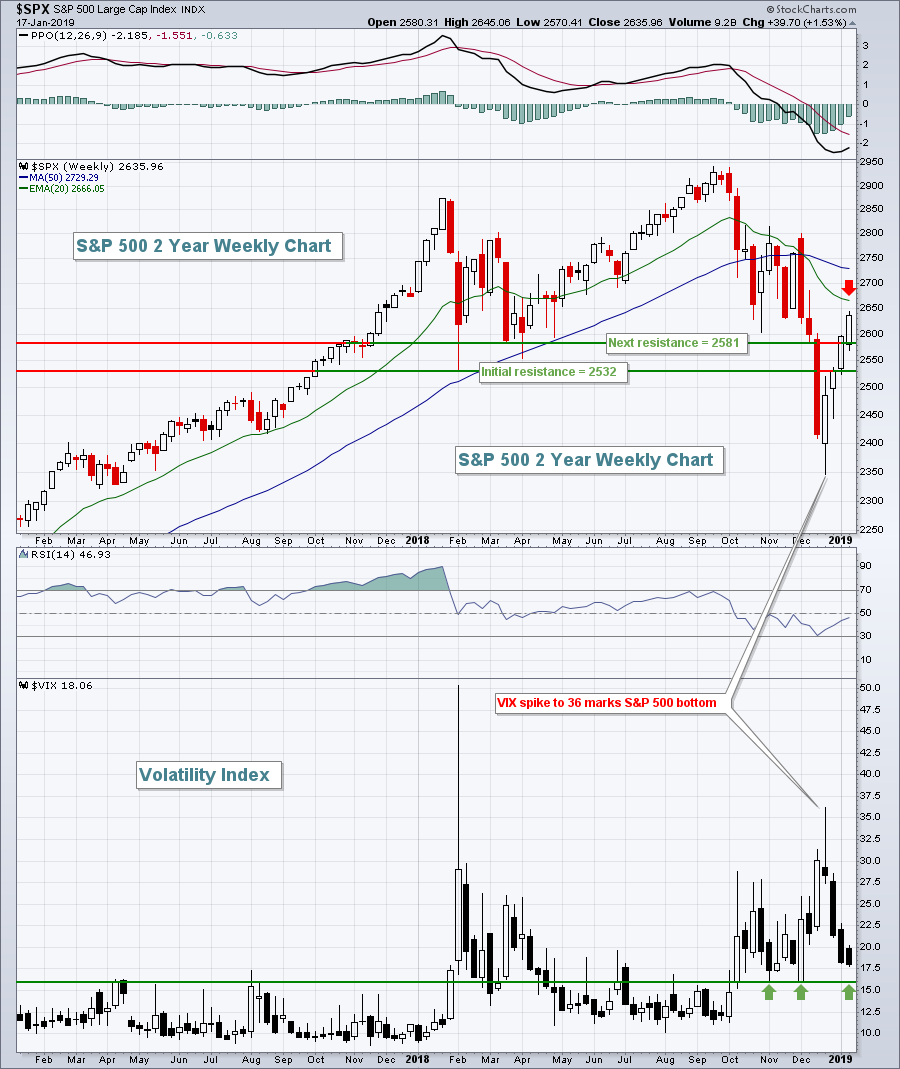
During each of the past two bear markets, the VIX never fell below 16. While I still believe the highest likelihood is that we see another leg lower in the U.S. stock market, a VIX move below 16 support would begin to suggest that the cyclical bear market low printed near 2350 and that it won't be broken. Clearly, the bears are facing a stiff test...
Read Full Story »»»
• DiscoverGold
Information posted to this board is not meant to suggest any specific action, but to point out the technical signs that can help our readers make their own specific decisions. Your Due Dilegence is a must!
• DiscoverGold
Join the InvestorsHub Community
Register for free to join our community of investors and share your ideas. You will also get access to streaming quotes, interactive charts, trades, portfolio, live options flow and more tools.

