


| Followers | 689 |
| Posts | 143817 |
| Boards Moderated | 35 |
| Alias Born | 03/10/2004 |
Friday, December 21, 2018 6:20:32 PM
DP (SPY) Weekly Wrap: Are Things As Bad As They're Going To Get?
By: Carl Swenlin | December 21, 2018
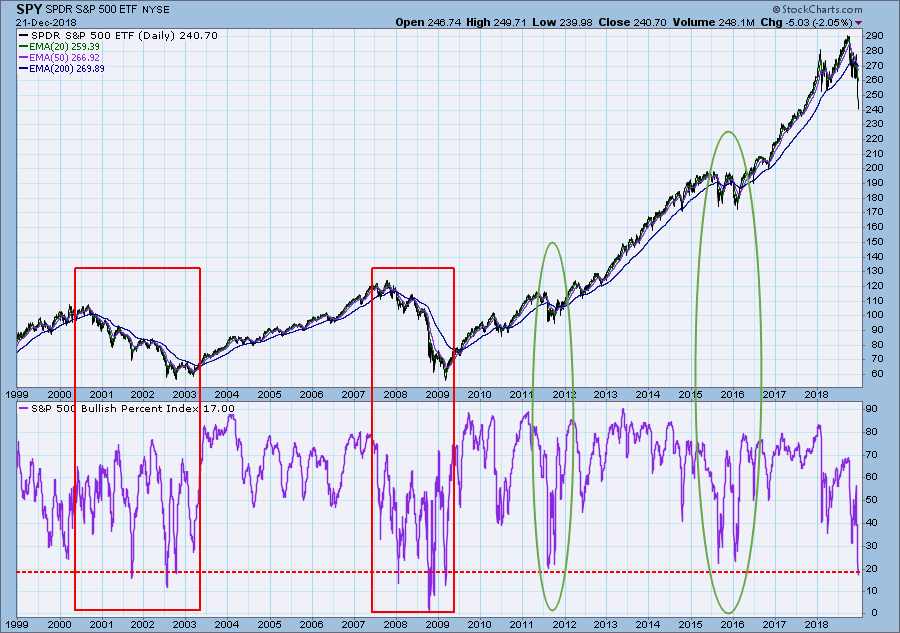
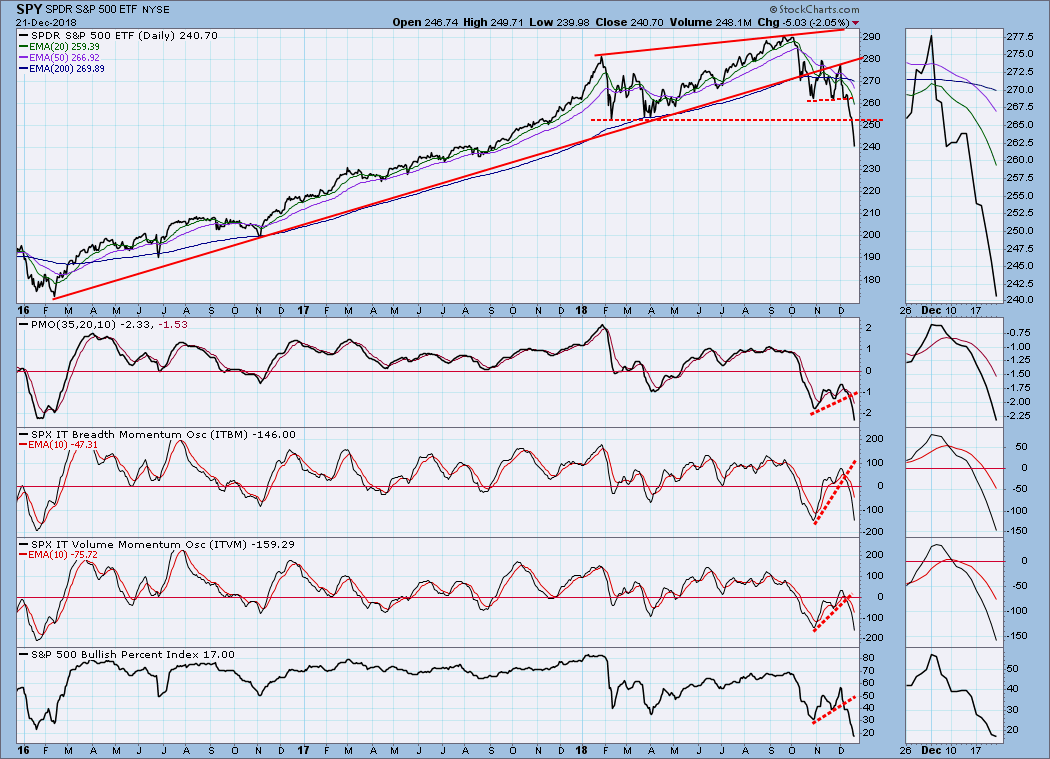
Less than three months ago there was a great lament about how employers couldn’t fill job positions because of a shortage of job seekers. This week FedEx announced voluntary employee buyouts, presumably to reduce payroll. In view of this, I offer you the Swenlin Basic Economic Theory: Things get better and better, until they are as good as they’re going to get. Then they get worse and worse, until they are as bad as they’re going to get. Repeat cycle. If you have a kid headed for college to study economics, think how much money I just saved you. Seriously though, the BPI (Bullish Percent Index), which is the percentage of S&P 500 stocks on technical BUY signals, shows that conditions are worse than they have been for almost 10 years. What may offer some hope to the bulls is that the low readings in 2011 and 2015/16 set the market up for major rallies. The problem is that those setups occurred during a secular bull market, and I think a secular bear market has begun. The two periods I have bracketed between 2000 and 2009 are probably more typical of what we are going to experience. Based upon that, it's probably going to get worse.
SECTORS
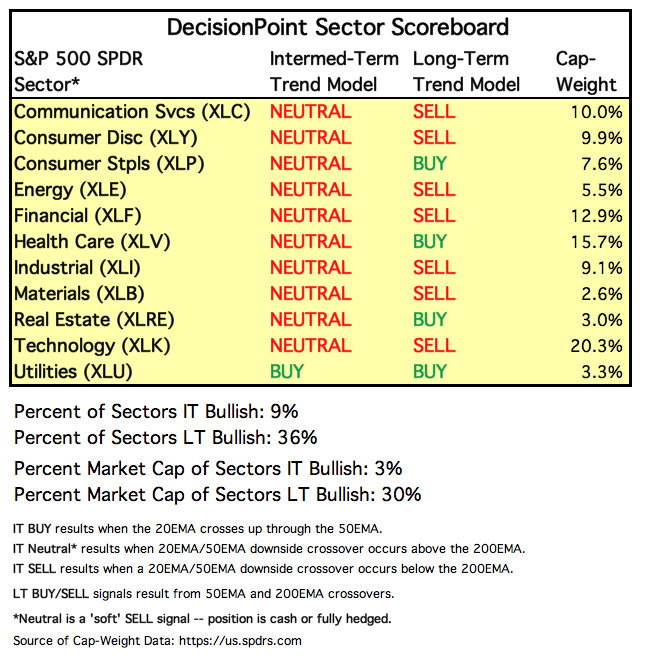
Each S&P 500 Index component stock is assigned to one, and only one, of 11 major sectors. This is a snapshot of the Intermediate-Term and Long-Term Trend Model signal status for those sectors.
STOCKS
IT Trend Model: NEUTRAL as of 10/15/2018
LT Trend Model: SELL as of 12/14/2018
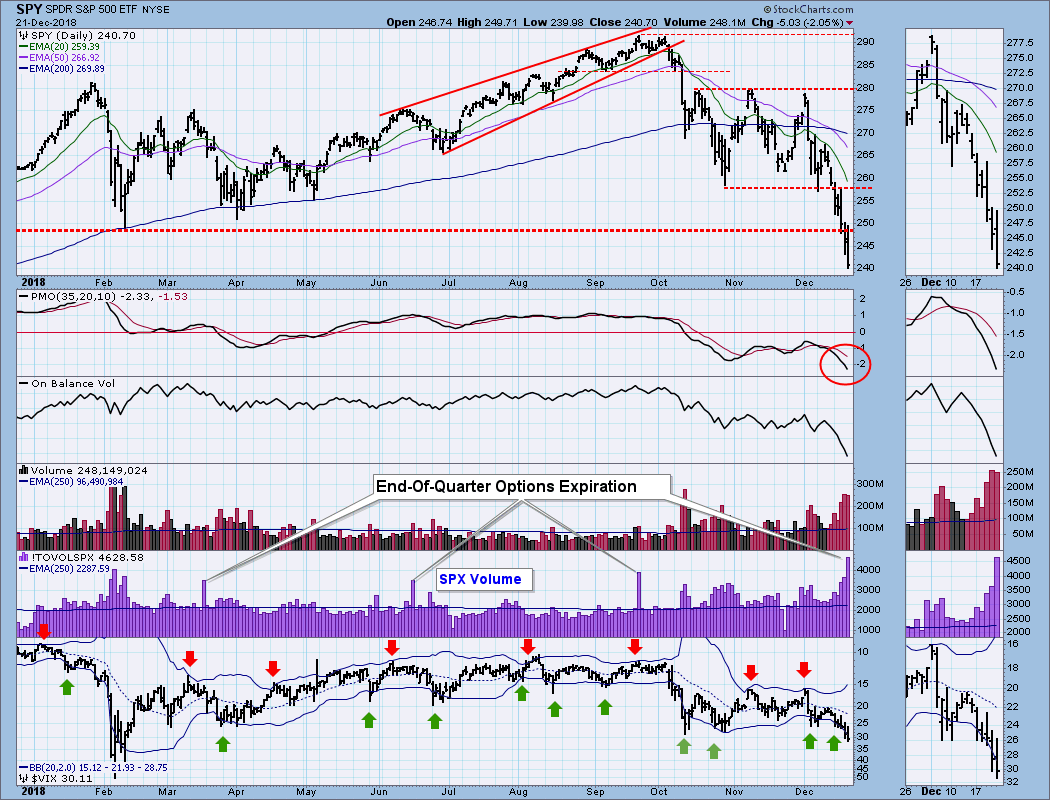
SPY Daily Chart: First, let me emphasize that today's huge volume spike (twice the 1-year average) was due to options expiration, so it shouldn't be used as evidence of a climax, blowoff, capitulation or anything else. End-of-quarter options expiration volume is usually extremely high, and I have noted this year's four events.
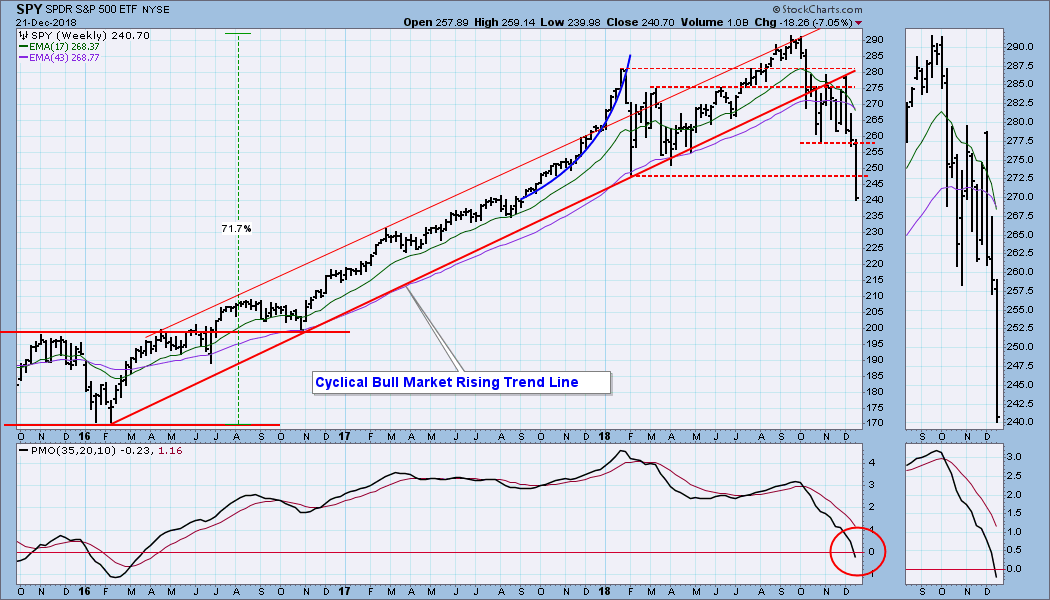
SPY Weekly Chart: This week saw the breakdown of two important levels of support, the most important of which was the line drawn from the February low. The weekly PMO also dropped below the zero line.
ULTRA-Short-Term Market Indicators: The VIX is beginning to push the lower Bollinger Band downward. Also, when the VIX touches that band, it is an oversold sign; unfortunately, we're in a bear market, and 'oversold' probably won't produce much, if any, price bounce. Recent New Lows readings of more than 161 compare with readings we saw in 2011 and 2015, but in 2008 we had a reading of 400 New Lows.
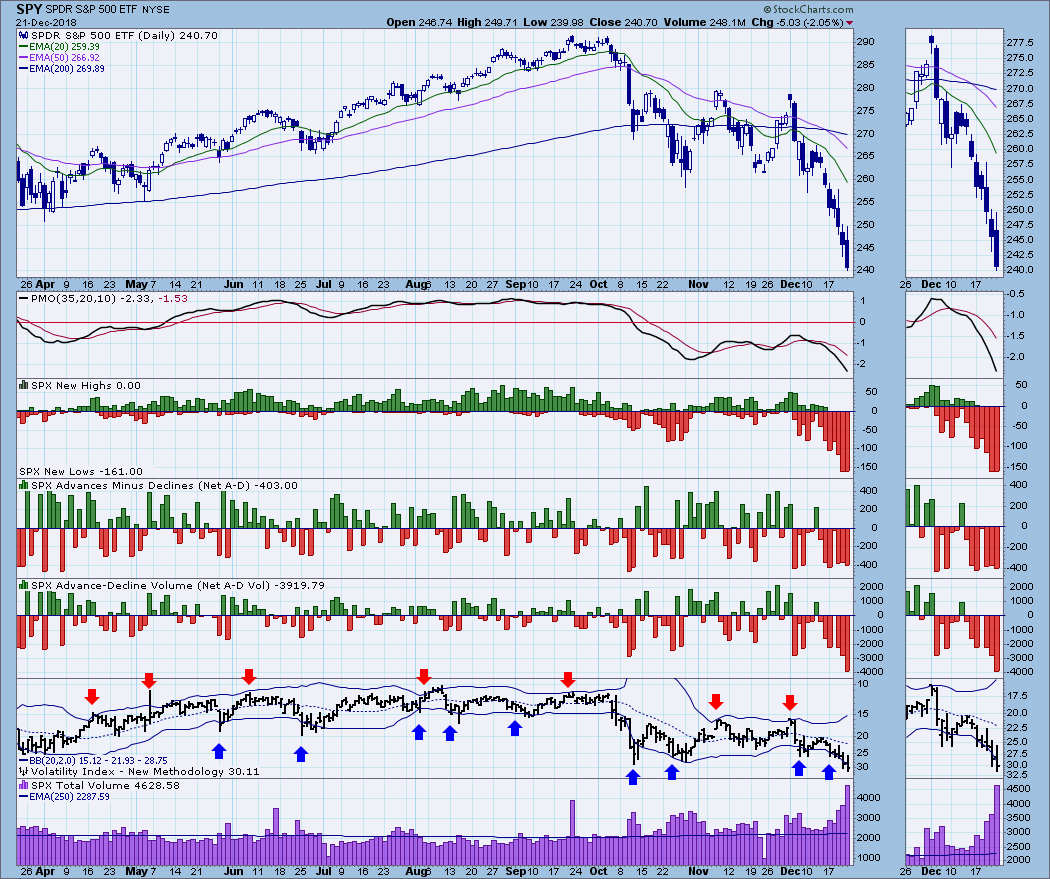
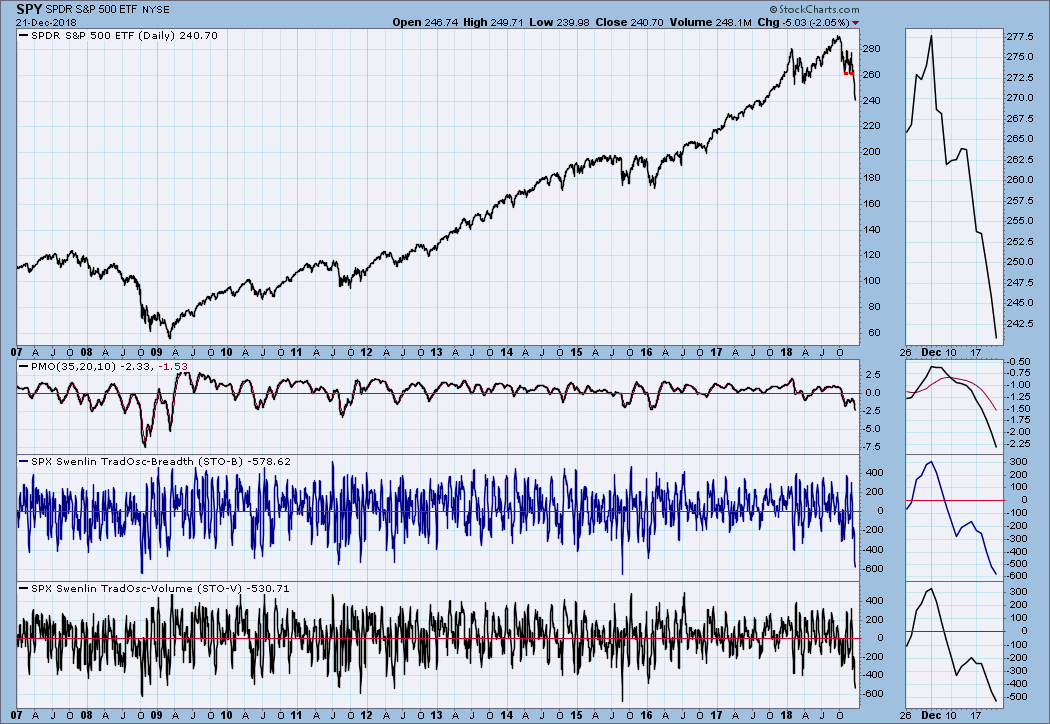
Short-Term Market Indicators: It is a bit dense, but I have used an 11-year chart to show how the STO-B and STO-V are dipping into the extreme oversold side of their historical range. A bounce wouldn't be out of order.
Intermediate-Term Market Indicators: Minus 200-250 is the bottom of the historical range for the ITBM and ITVM, so they could still accommodate more price decline.
CONCLUSION: I remember reflecting upon economic conditions earlier this year, particularly just before the October market top. Everything was 'coming up roses,' and market analysts had long lists of reasons why the market was going to continue higher. While I thought that things were probably going to turn for the worse soon, I admit it just seemed impossible for that to happen. Now all we hear is a long list of reasons why the market turned south. Those financial media! They have something for everyone! The point being, put this experience in your memory bank for future reference.
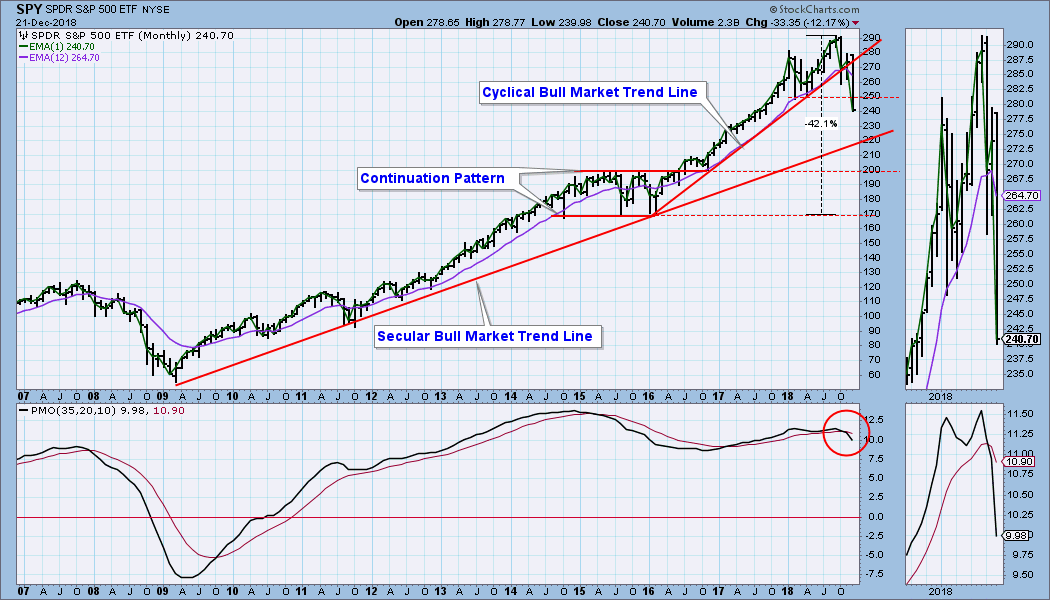
It is finally clear to most people that we are in a bear market, and we need to think about what is next. The two big bears in the 2000s were both -50% declines that lasted about 24 months and 18 months respectively. On the monthly chart below the most obvious support is drawn across the top and bottom of the 2015/16 consolidation. Reaching those levels would require declines of about -31% and -42% from the 2018 top, and it will probably take many months to get there. I don't know if those targets are low enough, but they are reasonable aim points, and I'm not even thinking that the bottom will be higher than that.
Read More »»»
• DiscoverGold
By: Carl Swenlin | December 21, 2018
Less than three months ago there was a great lament about how employers couldn’t fill job positions because of a shortage of job seekers. This week FedEx announced voluntary employee buyouts, presumably to reduce payroll. In view of this, I offer you the Swenlin Basic Economic Theory: Things get better and better, until they are as good as they’re going to get. Then they get worse and worse, until they are as bad as they’re going to get. Repeat cycle. If you have a kid headed for college to study economics, think how much money I just saved you. Seriously though, the BPI (Bullish Percent Index), which is the percentage of S&P 500 stocks on technical BUY signals, shows that conditions are worse than they have been for almost 10 years. What may offer some hope to the bulls is that the low readings in 2011 and 2015/16 set the market up for major rallies. The problem is that those setups occurred during a secular bull market, and I think a secular bear market has begun. The two periods I have bracketed between 2000 and 2009 are probably more typical of what we are going to experience. Based upon that, it's probably going to get worse.

SECTORS
Each S&P 500 Index component stock is assigned to one, and only one, of 11 major sectors. This is a snapshot of the Intermediate-Term and Long-Term Trend Model signal status for those sectors.

STOCKS
IT Trend Model: NEUTRAL as of 10/15/2018
LT Trend Model: SELL as of 12/14/2018
SPY Daily Chart: First, let me emphasize that today's huge volume spike (twice the 1-year average) was due to options expiration, so it shouldn't be used as evidence of a climax, blowoff, capitulation or anything else. End-of-quarter options expiration volume is usually extremely high, and I have noted this year's four events.

SPY Weekly Chart: This week saw the breakdown of two important levels of support, the most important of which was the line drawn from the February low. The weekly PMO also dropped below the zero line.

ULTRA-Short-Term Market Indicators: The VIX is beginning to push the lower Bollinger Band downward. Also, when the VIX touches that band, it is an oversold sign; unfortunately, we're in a bear market, and 'oversold' probably won't produce much, if any, price bounce. Recent New Lows readings of more than 161 compare with readings we saw in 2011 and 2015, but in 2008 we had a reading of 400 New Lows.

Short-Term Market Indicators: It is a bit dense, but I have used an 11-year chart to show how the STO-B and STO-V are dipping into the extreme oversold side of their historical range. A bounce wouldn't be out of order.

Intermediate-Term Market Indicators: Minus 200-250 is the bottom of the historical range for the ITBM and ITVM, so they could still accommodate more price decline.

CONCLUSION: I remember reflecting upon economic conditions earlier this year, particularly just before the October market top. Everything was 'coming up roses,' and market analysts had long lists of reasons why the market was going to continue higher. While I thought that things were probably going to turn for the worse soon, I admit it just seemed impossible for that to happen. Now all we hear is a long list of reasons why the market turned south. Those financial media! They have something for everyone! The point being, put this experience in your memory bank for future reference.
It is finally clear to most people that we are in a bear market, and we need to think about what is next. The two big bears in the 2000s were both -50% declines that lasted about 24 months and 18 months respectively. On the monthly chart below the most obvious support is drawn across the top and bottom of the 2015/16 consolidation. Reaching those levels would require declines of about -31% and -42% from the 2018 top, and it will probably take many months to get there. I don't know if those targets are low enough, but they are reasonable aim points, and I'm not even thinking that the bottom will be higher than that.

Read More »»»
• DiscoverGold
Information posted to this board is not meant to suggest any specific action, but to point out the technical signs that can help our readers make their own specific decisions. Your Due Dilegence is a must!
• DiscoverGold
Join the InvestorsHub Community
Register for free to join our community of investors and share your ideas. You will also get access to streaming quotes, interactive charts, trades, portfolio, live options flow and more tools.

