Tuesday, December 11, 2018 2:48:26 AM
S&P 500 - Symmetrical Triangle BREAKOUT
for Tuesday, December 11, 2018

_________________________________________________________________
The Kick-Off Months in the OTC - Jan/Feb - Jun/Jul
https://investorshub.advfn.com/boards/read_msg.aspx?message_id=137701925
_________________________________________________________________
The market continues to generally track
as expected.
After a five wave bull market,
with a subdividing third wave,
from SPX 1810 to SPX 2941,
the market reversed and appears to be
in a potentially short-lived bear market.
Our long term SPX count remains the same.
Five Intermediate waves up,
with a subdividing third wave,
from early-2016 to late-2018
to complete a Major wave 1 bull market
(1810-2941).
After that high
the market entered what we suspect
will be a short-lived Major wave 2 bear market,
with a possible loss of 15% to 20%.
The first decline of this bear market
bottomed in October at SPX 2604.
After the expected
Major wave 2 Bear Market ends,
the Primary III Secular Bull Market will resume.
https://caldaro.wordpress.com/2018/11/24/weekend-update-679/
https://caldaro.wordpress.com/2018/11/17/weekend-update-678/
https://caldaro.wordpress.com/2018/11/10/weekend-update-677/
https://caldaro.wordpress.com/

________________________________________________________________
Since we are expecting a three wave bear market
we are labeling the first decline
as Intermediate wave A,
and the current rally as Intermediate wave B.
Intermediate wave C should naturally follow
once this rally/uptrend concludes.
During the C
we are expecting the SPX
to break through the recent lows
with a maximum downside target
around SPX 2400 (green line).
After that
the next bull market should begin.
Keep in mind
we are in a Secular generational bull market,
and we are not expecting it to top
until the early 2030’s.

MEDIUM TERM: downtrend continues
This bear market started off simple enough:
a zigzag down to SPX 2604,
then an a-b-c rally to SPX 2815.
After that it has been a mess to count:
-200, +200, -200, +100, -100.
But Friday appears to have cleared it all up.
What it looks like we are dealing with
is an Intermediate wave A
taking the form of a double zigzag.
First
a Minor A zigzag SPX 2941-2603,
then
Minor B to SPX 2815,
now a
Minor C zigzag to SPX 2622 thus far.
It’s been quite choppy and volatile
just like a bear market.

Since Minor A dropped 337 points,
Minor C
should have some Fibonacci relationship to A
before it ends.
We see four possibilities:
SPX 2607 (0.618),
SPX 2577 (0.707),
SPX 2550 (0.786)
and
SPX 2478 (equal).
Two of these four fall within OEW pivots:
2577 and 2478
Too early to tell which is likely to work out.
But with all the political problems out there,
(US, China, Italy, France, and the UK),
any of these levels are possible.

SHORT TERM:
Trying to track this market
with short term waves
has been a near impossible task.
At times this market just seems to bounce
between OEW pivots
with no identifiable pattern.
Minute wave C,
of Minor C,
had
7 waves down to SPX 2622,
7 waves up to SPX 2709,
and now
5 waves down to SPX 2631,
(2643-2665-2623-2650-2631).
Another 7 wave pattern in the making ?
Hopefully
we will see the end of this downtrend soon.
Then we could get a good counter rally uptrend
for a while.
It will be interesting to see
how it all unfolds.
Best to your trading!
Trade what’s in front of you!
_______________________________________________________________


________________________________________________________________


________________________________________________________________
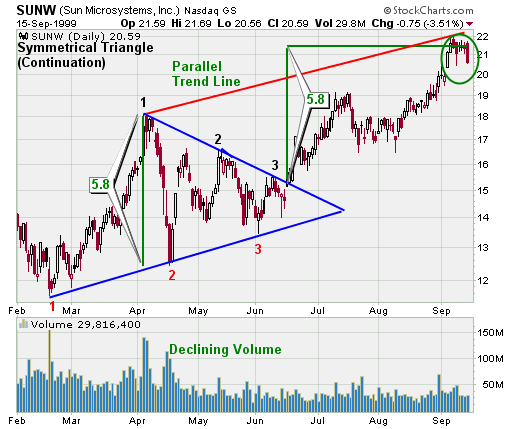
Symmetrical triangles
are usually continuation patterns
with converging trend lines.
Ideally,
a stock breaks out from a symmetrical triangle
prior to reaching the apex of the triangle
with volume expansion.
Chart Patterns
http://stockcharts.com/school/doku.php?id=chart_school:chart_analysis:chart_patterns
Symmetrical Triangle (Continuation)
http://stockcharts.com/school/doku.php?id=chart_school:chart_analysis:chart_patterns:symmetrical_triangle_continuation
http://thestockbandit.com/symmetrical-triangle/
http://thepatternsite.com/st.html

_________________________________________________________________
Trend:
In order to qualify as a continuation pattern,
an established trend should exist.
The trend
should be at least a few months old
and the symmetrical triangle
marks a consolidation period
before continuing after the breakout.
________________________________________________________________
Price Target:
There are two methods
to estimate the extent of the move after the breakout.
First,
the widest distance of the symmetrical triangle
can be measured and applied to the breakout point.
Second,
a trend line can be drawn
parallel to the pattern's trend line
that slopes (up or down) in the direction of the break.
The extension of this line
will mark a potential breakout target.
_________________________________________________________________


Symmetrical triangles
are usually continuation patterns
with converging trend lines.
Ideally,
a stock breaks out from a symmetrical triangle
prior to reaching the apex of the triangle
with volume expansion.
http://stockcharts.com/school/doku.php?id=chart_school:chart_analysis:chart_patterns:symmetrical_triangle_continuation
http://thestockbandit.com/symmetrical-triangle/
http://thepatternsite.com/st.html
_________________________________________________________________


http://stockcharts.com/h-sc/ui?s=%24SPX&p=W&yr=1&mn=5&dy=0&id=p84499328034

________________________________________________________________


for Tuesday, December 11, 2018
_________________________________________________________________
The Kick-Off Months in the OTC - Jan/Feb - Jun/Jul
https://investorshub.advfn.com/boards/read_msg.aspx?message_id=137701925
_________________________________________________________________
The market continues to generally track
as expected.
After a five wave bull market,
with a subdividing third wave,
from SPX 1810 to SPX 2941,
the market reversed and appears to be
in a potentially short-lived bear market.
Our long term SPX count remains the same.
Five Intermediate waves up,
with a subdividing third wave,
from early-2016 to late-2018
to complete a Major wave 1 bull market
(1810-2941).
After that high
the market entered what we suspect
will be a short-lived Major wave 2 bear market,
with a possible loss of 15% to 20%.
The first decline of this bear market
bottomed in October at SPX 2604.
After the expected
Major wave 2 Bear Market ends,
the Primary III Secular Bull Market will resume.
https://caldaro.wordpress.com/2018/11/24/weekend-update-679/
https://caldaro.wordpress.com/2018/11/17/weekend-update-678/
https://caldaro.wordpress.com/2018/11/10/weekend-update-677/
https://caldaro.wordpress.com/
________________________________________________________________
Since we are expecting a three wave bear market
we are labeling the first decline
as Intermediate wave A,
and the current rally as Intermediate wave B.
Intermediate wave C should naturally follow
once this rally/uptrend concludes.
During the C
we are expecting the SPX
to break through the recent lows
with a maximum downside target
around SPX 2400 (green line).
After that
the next bull market should begin.
Keep in mind
we are in a Secular generational bull market,
and we are not expecting it to top
until the early 2030’s.
MEDIUM TERM: downtrend continues
This bear market started off simple enough:
a zigzag down to SPX 2604,
then an a-b-c rally to SPX 2815.
After that it has been a mess to count:
-200, +200, -200, +100, -100.
But Friday appears to have cleared it all up.
What it looks like we are dealing with
is an Intermediate wave A
taking the form of a double zigzag.
First
a Minor A zigzag SPX 2941-2603,
then
Minor B to SPX 2815,
now a
Minor C zigzag to SPX 2622 thus far.
It’s been quite choppy and volatile
just like a bear market.
Since Minor A dropped 337 points,
Minor C
should have some Fibonacci relationship to A
before it ends.
We see four possibilities:
SPX 2607 (0.618),
SPX 2577 (0.707),
SPX 2550 (0.786)
and
SPX 2478 (equal).
Two of these four fall within OEW pivots:
2577 and 2478
Too early to tell which is likely to work out.
But with all the political problems out there,
(US, China, Italy, France, and the UK),
any of these levels are possible.
SHORT TERM:
Trying to track this market
with short term waves
has been a near impossible task.
At times this market just seems to bounce
between OEW pivots
with no identifiable pattern.
Minute wave C,
of Minor C,
had
7 waves down to SPX 2622,
7 waves up to SPX 2709,
and now
5 waves down to SPX 2631,
(2643-2665-2623-2650-2631).
Another 7 wave pattern in the making ?
Hopefully
we will see the end of this downtrend soon.
Then we could get a good counter rally uptrend
for a while.
It will be interesting to see
how it all unfolds.
Best to your trading!
Trade what’s in front of you!
_______________________________________________________________
________________________________________________________________
________________________________________________________________
Symmetrical triangles
are usually continuation patterns
with converging trend lines.
Ideally,
a stock breaks out from a symmetrical triangle
prior to reaching the apex of the triangle
with volume expansion.
Chart Patterns
http://stockcharts.com/school/doku.php?id=chart_school:chart_analysis:chart_patterns
Symmetrical Triangle (Continuation)
http://stockcharts.com/school/doku.php?id=chart_school:chart_analysis:chart_patterns:symmetrical_triangle_continuation
http://thestockbandit.com/symmetrical-triangle/
http://thepatternsite.com/st.html

_________________________________________________________________
Trend:
In order to qualify as a continuation pattern,
an established trend should exist.
The trend
should be at least a few months old
and the symmetrical triangle
marks a consolidation period
before continuing after the breakout.
________________________________________________________________
Price Target:
There are two methods
to estimate the extent of the move after the breakout.
First,
the widest distance of the symmetrical triangle
can be measured and applied to the breakout point.
Second,
a trend line can be drawn
parallel to the pattern's trend line
that slopes (up or down) in the direction of the break.
The extension of this line
will mark a potential breakout target.
_________________________________________________________________

Symmetrical triangles
are usually continuation patterns
with converging trend lines.
Ideally,
a stock breaks out from a symmetrical triangle
prior to reaching the apex of the triangle
with volume expansion.
http://stockcharts.com/school/doku.php?id=chart_school:chart_analysis:chart_patterns:symmetrical_triangle_continuation
http://thestockbandit.com/symmetrical-triangle/
http://thepatternsite.com/st.html
_________________________________________________________________


http://stockcharts.com/h-sc/ui?s=%24SPX&p=W&yr=1&mn=5&dy=0&id=p84499328034
________________________________________________________________

Join the InvestorsHub Community
Register for free to join our community of investors and share your ideas. You will also get access to streaming quotes, interactive charts, trades, portfolio, live options flow and more tools.


