


| Followers | 679 |
| Posts | 141164 |
| Boards Moderated | 36 |
| Alias Born | 03/10/2004 |
Monday, December 10, 2018 9:59:44 AM
By: Clive Maund | December 9, 2018
We will commence with commodities and to gain an overview, and we’ll start by looking at the latest long-term 14-year chart for the CRB commodity index. As we can see, it is starting to break down from a large bearish Rising Wedge, that started to form back at the beginning of 2016. This chart projects another severe downleg similar to the one that preceded the Wedge.

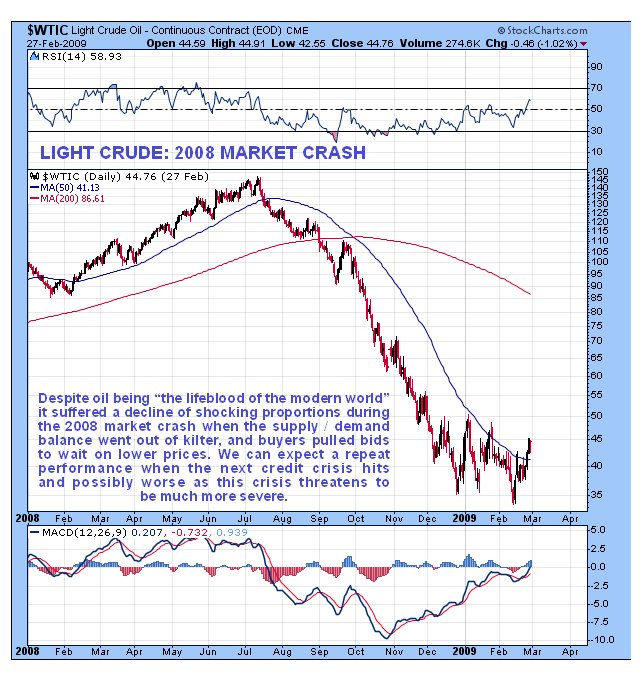
When we look at the brutal decline in commodities during the crash of 2008 on the chart below, it is perhaps not surprising that the outlook for commodities during a market crash is so grim…

A big component of the CRB index is the oil price, and as we know, oil has been dropping like a rock in recent weeks. The latest 10-year oil price chart looks terrible, and although it has lost one-third of its value in the space of a few months, it looks set to continue to plummet, and given that the emerging crisis is set to be far worse than that of 2008, it is clear that we could easily see the oil price back in the $20’s, or even the $10’s.

Oil cratered during the 2008 market crash, and unfortunately – or fortunately if you are a motorist – it looks set for a repeat performance…
As for copper there’s no good news there either. Copper found support in the $2.55 area, where we expected it to, but has not been able to gain any traction since, and now it appears to be marking out the Right Shoulder of a Head-and-Shoulders top, with the falling 200-day moving average coming into play and threatening to break it down from this potential top area. Again, if the strong support shown fails, a heavy drop will be in prospect.

What about gold and silver? – you would think that they would buck the trend, given their now historically bullish COTs and very positive gold to silver ratio. One would think so, but unfortunately it doesn’t look like they will for two reasons – one is that they will temporarily fall victim to across-the-board mass asset liquidation like everything else, and their performance during 2008 gives us a fine example of when that was actually the case. But the bullish COTs and super bullish gold to silver ratio must count for something surely? They do – they are indicating that if gold and silver drop again, dragged down by the mass asset liquidation, they are going to be like a beach ball pushed underwater, which will burst up to the surface immediately it becomes clear that the Central Banks are losing their nerve and set to revert to emergency QE, and they are likely to take off before it becomes clear that this is going to happen, since Smart Money will get wind of it before the mob, of usual, so we are going to have to be ready to move fast, as this time the PM sector will take off like a rocket and it won’t be coming down again.

You will recall that for a long time we thought that a complex Head-and-Shoulders bottom was forming in gold, but it is becoming increasingly clear that the pattern has been spoiled by the breach of the uptrend line shown on the right side of the pattern several months back, which makes gold vulnerable to further losses, especially given the bearish patterns that are unfolding across the commodity sector, particularly in oil. In a market crash situation it could drop to the bottom of the giant channel shown on our 10-year chart, which would put it at about $900, despite the seemingly bullish COTs and gold to silver ratio, which we can only presume will be more bullish still as gold hits bottom, leading to a violent reversal to the upside.
The big difference between now, in addition to all the fallback positions that existed back then having been used up or exhausted, is that the Treasury market looks set to tank too. Basically the world is awash with debt, especially given that the Fed is dumping Treasuries over the side as fast as it can with other CBs set to follow suit, and only a madman would buy it – or someone who is not spending his own money. See J P Morgan Spots The Next Big Problem – A Plunge In Global Bond Demand. The conclusion to all this is that yields are going to spike – and drive a stake through all risk assets. This is why at some point the CBs are expected to intervene with emergency QE, which will tank the dollar and send gold and silver through the roof.

So what is an investor to do? Broadly speaking the strategy is clear and simple. Apart from a few special situations or quick trades, the right strategy, until the Fed and other CBs fold and intervene, due to extreme pressure resulting from a market crash environment, is to be in cash and inverse ETFs. We have already taken positions in twice leveraged inverse ETFs and stand ready to go for some of the more risky triple leveraged ones once the broad US stock indices crash the support at their February – April lows, or look like they are on the verge of doing so, when we also selectively consider additional Put strategies. Many gold and silver shares should be either liquidated or hedged. Beyond that we will be on the lookout for the CBs panicking into emergency QE, which will spark the biggest stampede into the Precious Metals sector in history.
One final point – if we do see the customary Santa Claus rally, caused by adults temporarily losing their grip on reality due to festive good cheer and the easing of end-of-year tax loss selling, it won’t change anything, and there is a fair chance that the Grinch will cancel it this year.
So to sum up, a market crash looks imminent and if it doesn’t start immediately it should get underway quite soon. Our strategy at this time is to be generally short the market, using inverse ETFs, which it is thought best to refrain from trading, whilst long a few exceptional stocks such as several we will look at in coming days, and unless the Fed caves in on its rate rise program, it is thought best to hold off from buying most PM sector investments until the initial crash phase has almost run its course. Options, especially Puts for the downside, we will of course trade much more aggressively, which is what they are meant for, an example being the trades last week where we tripled our money in Amazon, Apple and Home Depot Puts in 2 trading days, and if we can time the breakdown into the main crash, we will consider adding some triple leveraged inverse ETFs the better to capitalize on it.
Read More »»»
• DiscoverGold
Information posted to this board is not meant to suggest any specific action, but to point out the technical signs that can help our readers make their own specific decisions. Your Due Dilegence is a must!
• DiscoverGold
VAYK Discloses Strategic Conversation on Potential Acquisition of $4 Million Home Service Business • VAYK • May 9, 2024 9:00 AM
Bantec's Howco Awarded $4.19 Million Dollar U.S. Department of Defense Contract • BANT • May 8, 2024 10:00 AM
Element79 Gold Corp Successfully Closes Maverick Springs Option Agreement • ELEM • May 8, 2024 9:05 AM
Kona Gold Beverages, Inc. Achieves April Revenues Exceeding $586,000 • KGKG • May 8, 2024 8:30 AM
Epazz plans to spin off Galaxy Batteries Inc. • EPAZ • May 8, 2024 7:05 AM
Moon Equity Holdings, Corp. Announces Acquisition of Wikolo, Inc. • MONI • May 7, 2024 9:48 AM

